
- Title
-
Mechanism of gating and partial agonist action in the glycine receptor
- Authors
- Yu, J., Zhu, H., Lape, R., Greiner, T., Du, J., Lü, W., Sivilotti, L., Gouaux, E.
- Source
- Full text @ Cell

Single channel electrophysiology and cryo-EM analysis of the glycine complex.
A. Single-channel recording of GlyR openings in the presence of 10 mM glycine. B. Fractions of GlyR particles in the desensitized, open and expanded/super-open states in nanodiscs, SMA, or detergent micelles. Error bars represent SEM, as described in the Methods. C. Plots of pore radius for glycine-bound states. The Cα position of Arg 268 (M2 0’) is set to 0. D-F. Cryo-EM density maps. The partially transparent surface represents lipid-SMA density. G-I. Ion permeation pathways where M2 helices of two subunits are shown in ribbon and the side chains of pore-lining residues are shown in sticks, calculated by the program HOLE (radii coloring: red <1.8 Å, green 1.8–3.3 Å, and blue > 3.3 Å). See also Figures S1–S2, Tables S1–S2, S5, S7 and Data S1 |

Partial agonist complexes probed by electrophysiology and cryo-EM.
A. Representative cell-attached single-channel recordings of GlyR openings elicited by 100 mM taurine and 100 mM GABA, respectively. B. Fractions of GlyR particles in the open, closed, desensitized and expanded-open states of the glycine, taurine and GABA complexes of the SMA-solubilized receptor, calculated by RELION and cisTEM as described in the Methods. Error bars represent SEM. C. Whole cell, dose-response data for glycine, taurine and GABA. EC50 for glycine, taurine and GABA are 190 ± 20 μM, 1050 ± 80 μM and 28.4 ± 0.9 mM, respectively. Error bars represent SEM and n≥6 cells for all experiments. Curves are normalized to the glycine maximum current recorded in each cell. D-F. Distances (in angstrom) and conformation of residues −2’P and 9’L in the taurine-bound, SMA-solubilized receptor in the open, desensitized and closed states. G-I. Ion permeation pathway for taurine-bound states, calculated using HOLE and plotted as in Figure 1. J-K. Pore radius as a function of distance along the pore axis for taurine-bound states (J) and GABA-bound states (K) of the SMA-solubilized receptor. See also Figures S1, S3–S5, Tables S1–S3, S5, S7, Methods S1–S2 and Data S1. |

Neurotransmitter binding sites.
A-C. Illustration of the densities for glycine, taurine and GABA, contoured at 11 σ, 10 σ, and 8 σ, respectively. For the neurotransmitters, carbon and sulfate atoms are colored in black, whereas nitrogen and oxygen atoms are in blue and red, respectively. D-F Glycine, taurine and GABA binding sites showing hydrogen bonds and cation-π interactions as dashed lines. G. Illustration of conformational changes produced by the binding of glycine, taurine and GABA by superimposing the respective extracellular domains (ECDs). H. Schematic diagram illustrating the changes in distances (angstrom) of key residues for the glycine, taurine and GABA-bound open states. The glycine, taurine and GABA structures are green, gray and pink, respectively. I. Conformational changes of the binding pockets in the apo state, glycine-bound open, taurine-bound open and taurine-bound closed states by superimposing the main chain atoms of the ECDs. See also Figures S8 and Table S6. |

YGF mutation renders GABA a high efficacy agonist.
A. Whole cell, dose response data for glycine and GABA for full length (FL) or the YGF mutant. EC50 for glycine at FL and YGF mutant are 190 ± 20 μM and 33 ± 3 μM, respectively. EC50 for GABA to FL and YGF mutant are 28.4 ± 0.9 mM and 1.05 ± 0.08 mM, respectively. Error bars represent SEM and n≥6 cells for all experiments. Responses are normalized to maximum responses to glycine in each cell. B. Cell-attached single-channel recording showing openings of the YGF mutant produced by 100 mM GABA. C. Competition ligand binding experiment using 3H-strychnine. Data are shown as means ± SEM (n=3). Ki of GABA to FL and YGF mutant are 1.41 ± 0.94 mM and 0.18 ± 0.07 mM, respectively. Kd of 3H-strychnine in the FL and YGF mutant are 220 ± 3 nM and 54 ± 4 nM, respectively. D. GABA binding site in the YGF mutant viewed parallel to the membrane (left) or from the extracellular side of the membrane (right). GABA density is contoured at 0.013 σ. The possible hydrogen bonds and cation-π interactions are shown as dashed lines. E. Superimposition of the binding pockets from the FL and YGF mutant in the presence of GABA to show the impact on the binding pocket of the swap between Y177 and F175. F. Conformational changes in the binding pockets of the open states of GABA-bound YGF mutant and FL and glycine-bound FL shown by superposing the ECDs. G. Schematic diagram illustrating changes in the distances in the binding pocket of the GABA-bound YGF mutant (blue) and FL (pink) as well as glycine-bound FL (green). H. Plots for pore radius as a function of distance along the pore axis for GABA-bound YGF mutant in the open, desensitized and expanded-open states. See also Figure S6 and Table S4. |
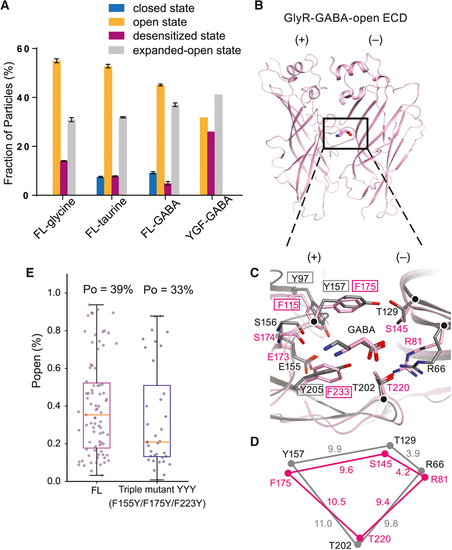
Particle distributions, binding pocket comparisons between GlyR and the α1β1γ2 GABA receptor-GABA complex and single channel open probabilities.
A. Fractions of GlyR particles in different states in the FL and YGF mutant, calculated by RELION and cisTEM. Error bars represent SEM. B. Extracellular domain (ECD) of the open state of the GABA complex in SMA. C. Superposition of the GABAAR (in grey; PDB code: 6DW1) and YGF mutant (in pink) structures highlights differences in the binding pockets. The Cα atoms of key residues are represented as spheres. D. Schematic diagram illustrating the distances of the Cα atoms of R81, F175, S145 and T220 in the GlyR and corresponding residues in the GABAAR structure. E. The open probabilities (Po) of the FL and the triple mutant (F115Y+F175Y+F223Y) elicited by 100 mM GABA. Error bars represent SEM and n≥6 cells for all experiments. |

Conformational changes between the open, desensitized and closed states.
A. Structure of the taurine-open state. Two subunits are shown in cartoon and the other three subunits are represented as partially transparent surfaces. Taurine is in sphere representation. The binding pocket in the ECD, the ECD-TMD interface and the TMD are indicated by a black solid, a black dashed and a purple solid rectangle, respectively. B-G. Superposition of the (−) subunit illustrates the relative movements in the (+) subunit. Hydrogen bonds are shown in dashed lines. The taurine-open, taurine-desensitized and taurine-closed states are colored in yellow, salmon and cyan, respectively. (B. D) Comparison of the binding pocket (B) and ECD-TMD interfaces (D) between taurine-open and taurine-desensitized states. (C. E) Conformational changes in the binding pockets (C) and the ECD-TMD interfaces (F) between taurine-closed, taurine-open states. (F. G) Illustration of the changes in distances of the Cα atoms of key residues in the binding pockets (F) and ECD-TMD interfaces (G) between taurine-open and taurine-closed states. Cα atoms in the taurine-open and taurine-closed states are represented by yellow and blue balls, respectively. H-I. Superimposition of a single subunit illuminates the changes in the TMD between taurine-closed, taurine-open and taurine-desensitized states. The M1, M3 and M4 helices are shown as cylinders while the M2 helix is shown in cartoon representation. J. The plot of the differences in the position of Cα atoms from residues in the M2 helix derived from the taurine-open, taurine-desensitized and taurine-closed states. Two constriction sites are indicated by dash lines. From open to desensitized states, the major changes are concentrated at the lower half of the M2 helix with −2’P moving by 1.4 Å. By contrast, the M2 helix undergoes a larger conformational change upon transition from the closed to open states. See also Figures S7–S8. |

GlyR gating mechanism.
The ECD changes promote the transition from closed to the open state (A-C), while sustained binding of partial agonist promotes a further transition into the desensitized state (C-D). |
Reprinted from Cell, 184, Yu, J., Zhu, H., Lape, R., Greiner, T., Du, J., Lü, W., Sivilotti, L., Gouaux, E., Mechanism of gating and partial agonist action in the glycine receptor, 957-968.e21, Copyright (2021) with permission from Elsevier. Full text @ Cell