
|
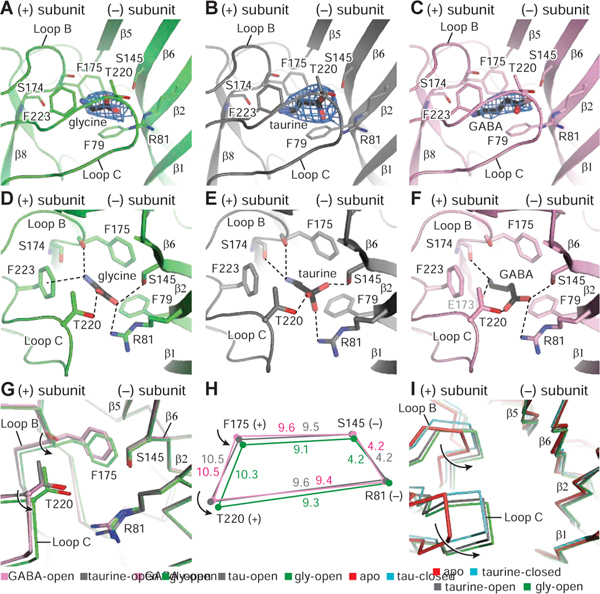
Fig. 3
A-C. Illustration of the densities for glycine, taurine and GABA, contoured at 11 σ, 10 σ, and 8 σ, respectively. For the neurotransmitters, carbon and sulfate atoms are colored in black, whereas nitrogen and oxygen atoms are in blue and red, respectively.
D-F Glycine, taurine and GABA binding sites showing hydrogen bonds and cation-π interactions as dashed lines.
G. Illustration of conformational changes produced by the binding of glycine, taurine and GABA by superimposing the respective extracellular domains (ECDs).
H. Schematic diagram illustrating the changes in distances (angstrom) of key residues for the glycine, taurine and GABA-bound open states. The glycine, taurine and GABA structures are green, gray and pink, respectively.
I. Conformational changes of the binding pockets in the apo state, glycine-bound open, taurine-bound open and taurine-bound closed states by superimposing the main chain atoms of the ECDs.
See also Figures S8 and Table S6.
Reprinted from Cell, 184, Yu, J., Zhu, H., Lape, R., Greiner, T., Du, J., Lü, W., Sivilotti, L., Gouaux, E., Mechanism of gating and partial agonist action in the glycine receptor, 957-968.e21, Copyright (2021) with permission from Elsevier. Full text @ Cell