
- Title
-
Modulation of PPAR signaling disrupts pancreas development in the zebrafish, Danio rerio
- Authors
- Venezia, O., Islam, S., Cho, C., Timme-Laragy, A.R., Sant, K.E.
- Source
- Full text @ Tox. App. Pharmacol.
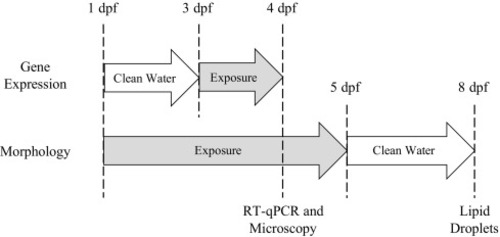
Exposure paradigms utilized in this study to assess gene expression, morphology, and adiposity. Embryos were exposed for 24 h from 3 to 4 dpf prior to assessment of gene expression in 4 dpf embryos. PPAR gene expression in embryos greatly increases beginning at 3 dpf, and therefore the gene expression paradigm was fitted to this window of exposure. For morphological experiments, embryos were exposed from 1 to 4 dpf prior to microscopy. To assess adiposity, embryos were exposed from 1 to 5 dpf, and then transferred to clean water until larval imaging at 8 dpf. |
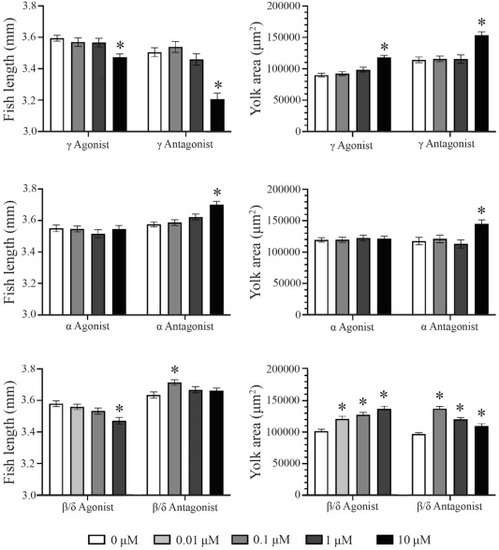
PPAR isoform modulation impacts fish growth and yolk utilization. Fish length and yolk sac area were measured at 4 dpf, following developmental (3 day) exposures to PPAR agonists and antagonist across a range of concentrations. PPARγ agonist and antagonist exposures decreased fish length and increased yolk sac area at 10 μM. PPARα antagonist, but not agonist, exposures increased fish length as well as yolk sac area. Additionally, PPARβ/δ antagonist exposure increased fish length as well as yolk sac area, while agonist exposure decreased fish length and increased yolk sac area. Asterisks (*) indicate a difference between designated treatment groups and DMSO control (p < 0.05); n = 75–90 eleutheroembryos per group. |
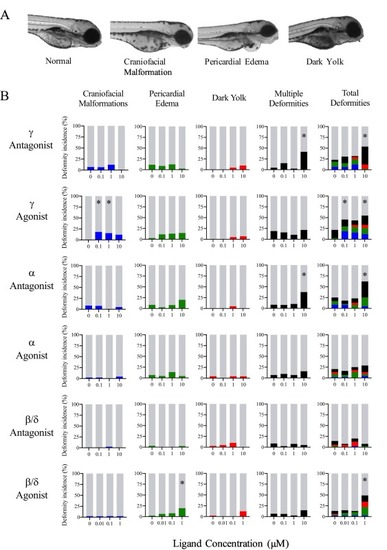
Modulation of all PPAR isoforms increases the incidence of morphological deformities. A.) Embryos were examined microscopically for craniofacial malformations, pericardial edema, and darkened yolk sacs following exposure to PPAR agonists and antagonists. B.) PPARγ antagonist exposure displayed increased occurrence of comorbidities presenting as darkened yolk sacs accompanied by either pericardial edema or craniofacial malformation. PPARγ agonist exposure displayed an increased occurrence of craniofacial malformations alone and total deformity as well. Treatment with 10 μM PPARα antagonist resulted in a significant increase in total deformity, with a notable increase in multiple deformities that include pericardial edema. PPARβ/δ antagonist exposure increased pericardial edema and total deformities at 1 μM. Asterisks (*) indicate a difference between designated treatment group and the controls (p < 0.05); n = 75–90 eleutheroembryos. |

PPARγ modulation decreases islet area. Islet areas were approximated by quantifying the β cell area in 4 dpf Tg(insulin-GFP) transgenic zebrafish. At the highest exposure concentration (10 μM), both antagonist and agonist exposure significantly decreased islet area. Boxplots are shown to indicate data quartiles, and p-values are shown comparing the control and 10 μM groups above the plots. n = 36–42 antagonist; n = 30–40 agonist eleutheroembryos. |

PPAR modulation increases the incidence of aberrant islet morphologies at 4 dpf. Images were blinded prior to classification, and the incidence of ectopic β cells, fragmented islets, and hypomorphic islets (falling below the 10th percentile of controls) was recorded. For all PPAR isoforms, antagonism did not increase the incidence of aberrant islet morphologies (p > 0.05), while agonism increased incidence of aberrant islet morphologies (p < 0.05). Asterisks (*) above bars indicate a difference in total aberrant islet morphology between designated treatment group and the controls while asterisks within bars indicate a difference only in the associated morphology between designated treatment group and the controls (p < 0.05); n = 30–42 for each exposure group. |
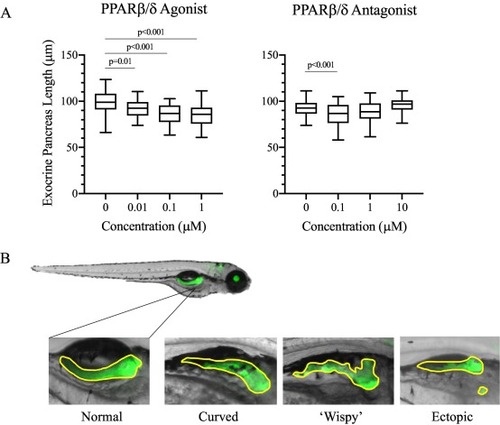
PPAR modulation impairs exocrine pancreas length and morphology. A) Exocrine pancreas length was measured in Tg(ptf1a-GFP) transgenic along the nasal-caudal axis. PPARβ/δ antagonist exposure significantly decreased pancreas length, displaying an inverted U-shaped curve, and agonist exposure significantly decreased pancreas length in a concentration dependent manner. Data is presented as boxplots and represents the quantiles for each set of data, and significant p-values are indicated above each plot (p < 0.05). n = 40–45 antagonist, n = 38–47 agonist eleutheroembryos. B) Aberrant pancreatic morphologies observed due to PPAR modulation included curved, wispy, and ectopic exocrine variants. Incidence of aberrant morphologies is presented in Table 2. |
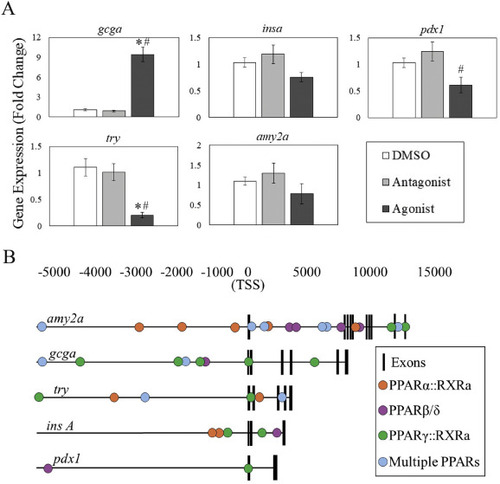
Modulation of PPAR signaling impacts pancreatic gene expression. A) Gene expression of endocrine (gcga, insa, pdx1) and exocrine (try, amy2a) pancreas transcripts was assessed following PPARβ/δ modulation using qPCR. Agonism of PPARβ/δ increases gcga expression by almost 10-fold, and decreases expression of pdx1 and try, indicative of potential endocrine and exocrine effects. B) Putative PPAR transcription factor binding sites (TFBS) were examined in the promoters of pancreatic gene targets. Each gene had several isoform-specific or multiple isoform binding sites in the promoter or gene body, including several directly adjacent to the transcription start site. Asterisks (*) indicate a significant difference between controls and a PPAR modulator, while octothorpes (#) indicate a significant difference between the agonist and antagonist. α = 0.05, n = 6–10 samples per group each containing 8–10 pooled embryos. |

PPAR modulation alters lipid accumulation at 8 dpf. Nile Red plate reader assay was performed to quantify larval lipid accumulation 3 days after discontinuing exposure. All values are normalized to control. (A,B) Larvae exposed to the PPARγ antagonist had decreased neutral lipid accumulation, while those exposed to the agonist were increased. (C) PPARα antagonist exposure displayed an increasing trend in lipid accumulation, however not significant. Conversely, agonist exposure decreased lipid accumulation. (D) Both PPARβ/δ antagonist and agonist exposure significantly decreased lipid accumulation in a concentration dependent manner. Asterisks (*) indicate a difference between designated treatment group and the control (p < 0.05). n = 13–16 biological replicates for PPARα; n = 7–10 PPARβ/δ; n = 10–13 for PPARγ. (For interpretation of the references to color in this figure legend, the reader is referred to the web version of this article.) |