
- Title
-
A neuronal circuit that generates the temporal motor sequence for the defensive response in zebrafish larvae
- Authors
- Xu, L., Guan, N.N., Huang, C.X., Hua, Y., Song, J.
- Source
- Full text @ Curr. Biol.
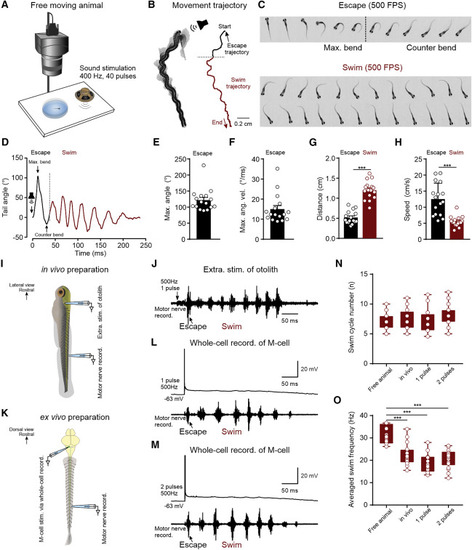
The single M-cell-activation-induced defensive motor sequence led by initial escape and transited to subsequent swim (A) Experimental setup for monitoring the sound-induced defensive motor sequence via a high-speed camera (500 fps). (B) The illustrated movement trajectory of a video-recorded 12-dpf zebrafish defensive motor sequence induced by sound stimulation, containing two continuous behaviors, escape (black trace) and swim (red trace). The black arrow indicates the initial head direction, and the red arrow represents the heading direction at the end of the movement. (C) Illustration of dynamic body images of escape behavior (every frame) and swim behavior (every other frame) during the defensive motor sequence in (B). Each frame represents 2 ms. (D) The plot exhibiting the real-time tail bending angles of the defensive motor sequence in (B). (E and F) Average maximal tail bending angle (E) and average maximal tail angular velocity (F; n = 16 fish). (G and H) Distance traveled (G) and movement speed (H) of the escape and swim behaviors during defensive motor sequence (Student’s t test; n = 16 fish for both G and H). (I) Drawing illustrating the extracellular stimulation of otolith and extracellular motor nerve recording in the in vivo preparation. (J) Stimulation of otolith in the in vivo preparation induced a defensive motor sequence consisting of the initial escape and the following swim activity. The black arrow indicates escape burst. (K) Drawing illustrating the whole-cell recording in an M-cell and extracellular motor nerve recording in the ex vivo preparation. (L) One action potential in an M-cell induced a defensive motor sequence of escape and swim. Black arrow indicates the escape burst. (M) Two action potentials generated in M-cell induced a similar defensive motor sequence of escape and swim. Black arrow indicates the escape burst. (N) Average swim cycle during the defensive motor sequence for freely moving animals, in vivo preparations, 1 pulse stimulation of M-cells, and 2 pulses stimulation of M-cells (one-way ANOVA; n = 16 fish for free animal; n = 18 fish for in vivo; n = 24 fish for both 1 pulse and 2 pulses). (O) Average swim frequency of swim activity during the defensive motor sequence for free-moving animals and in vivo preparations, 1 pulse stimulation of M-cells, and 2 pulses stimulation of M-cells (one-way ANOVA; n = 16 fish for free animal; n = 18 fish for in vivo; n = 24 fish for both 1 pulse and 2 pulses). All graphs show mean ± SEM, and circles show individual data points; ∗∗∗p < 0.001. |
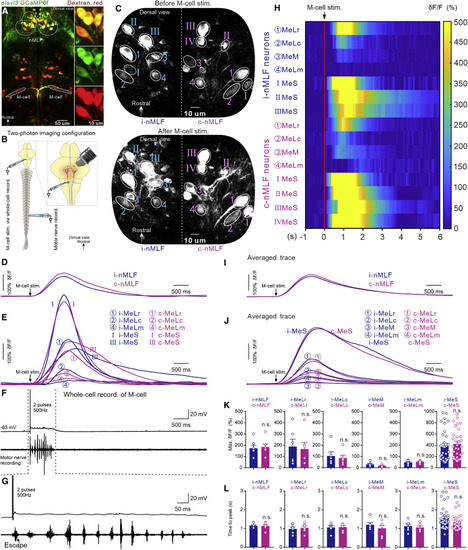
Unilateral M-cell activation recruited neurons in bilateral nMLF during defensive motor sequence (A) Retrograde labeling of neurons in nMLF by rhodamine dextran in the Tg (elavl3: GCaMP6f) fish line. Descending neurons in nMLF express both green and red fluorescence. (B) The experimental configuration of two-photon calcium imaging with simultaneous whole-cell, patch-clamp recording of M-cells and recording of tail motor nerve activity. (C) Images showing GCaMP6f fluorescence intensity in neurons of bilateral nMLF before M-cell stimulation (upper panel) and after M-cell stimulation (lower panel). (D–F) Typical traces illustrating the dynamic response of calcium change in the ipsilateral (blue) and contralateral (purple) nMLF (D) and MeLr, MeLc, MeLm, and MeS neurons of bilateral nMLF (E) when M-cell activation (F, top) induced a defensive motor sequence recorded from the tail motor nerve (F, bottom). (G) Enlargement of the region of the trace bounded by the dash lines in (F). The black arrow shows the escape burst. (H) Heatmap of the calcium responses of neurons shown in (C)–(F). (I) Average calcium response curves from seven experiments of neurons in ipsilateral and contralateral nMLF during M-cell-activation-induced defensive motor sequence. Black arrow indicates when action potentials were generated in M-cell. (J) Average calcium responses of MeLr, MeLc, MeM, MeLm, and MeS neurons of bilateral nMLF during M-cell-activation-induced defensive motor sequence. Black arrow indicates when action potentials were generated in M-cell. (K) There were no significant differences in the maximum amplitude of calcium responses in ipsilateral neurons and its contralateral counterparts (Student’s t test; n = 6 fish; each dot represents one neuron for all groups). (L) There was no significant difference in the time to peak calcium response in ipsilateral neurons and its contralateral counterparts (Student’s t test; n = 6 fish; each dot represents one neuron for all groups). Blue traces and bars represent ipsilateral neurons; purple traces and bars represent contralateral neurons. All graphs show mean ± SEM, and each circle shows individual neurons from different preparation; n.s. represents no significant difference. |

Neurons in nMLF are driven by M-cell activation via indirect synaptic connection and can be divided into three functional and spatial subgroups based on their recruitment patterns (A) Line drawing illustrating the paired whole-cell, patch-clamp recording in M-cell and neurons in bilateral nMLF. (B) Image of retrograde labeling of neurons in bilateral nMLF. The numbers in the image indicate the identity of neurons in nMLF. (C and D) A single action potential generated in the M-cell induced transient discharge of action potentials in MeLr, MeLc, MeLm, as well as in MeS-T neurons and sustained discharge of action potentials in MeS-P neurons but only EPSPs in MeM neurons in both ipsilateral (blue traces in C) and contralateral (purple traces in D) nMLF. Application of high Ca2+/Mg2+ solution (gray traces in C and D) prevented or greatly reduced the firing of these neurons. (E and F) Raster plots of the transient firing pattern of action potentials for MeLr (n = 7 neurons in 7 fish), MeLc (n = 6 neurons in 6 fish), MeLm (n = 5 neurons in 5 fish), as well as MeS-T (n = 11 neurons in 11 fish) neurons; the sustained discharge of action potentials in MeS-P (n = 16 neurons in 11 fish) neurons; and lack of action potentials in MeM and MeS-N neurons in both ipsilateral and contralateral nMLF. Red vertical line indicates the time of stimulation of M-cells. (G) Contour plot of the nMLF neuron density based on different recruitment patterns by M-cell stimulation showing the spatial distribution of three subgroups (numbers of neurons for P, T, and N subgroups were 34, 42, and 47 for left nMLF and 36, 43, and 52 in right nMLF). See also Figure S1 and Videos S1 and S2. |

Laser ablation of neurons in nMLF impaired the swim activity during M-cell-activation-induced defensive motor sequence (A) Rhodamine dextran retrogradely labeled descending neurons in nMLF before (left) and after (right) two-photon laser ablation. (B) In the control group, two spikes generated in an M-cell triggered the defensive motor sequence of initial escape and subsequent swim in wild-type fish. Laser ablation of neurons in nMLF abolished the swim behavior. (C) Average swim burst number is significantly different between the control group and laser ablation group (Student’s t test; n = 6 fish). Circles indicate individual data points. ∗∗∗p < 0.001. |
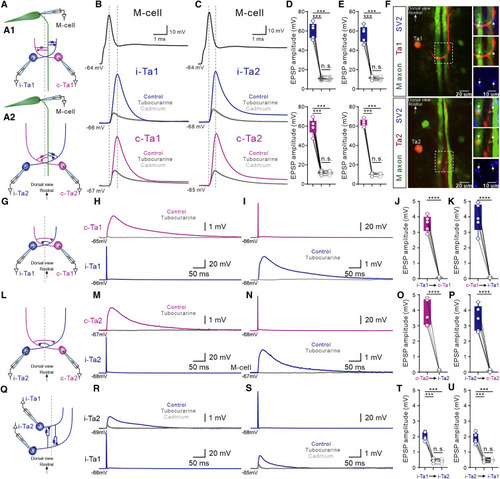
Cranial relay neurons were interconnected to form an excitatory feedforward circuit (A) Line drawing showing the triple whole-cell, patch-clamp recording in M-cell, i-Ta1, and c-Ta1 neurons (A1) or M-cell, i-Ta2, and c-Ta2 neurons (A2). (B) An action potential generated in the recorded M-cell drove the recorded i-Ta1 and c-Ta1 neurons to discharge a single action potential, which were decreased to EPSPs in both i-Ta1 and c-Ta1 neurons in the presence of tubocurarine. EPSPs in both neurons persisted in cadmium (gray). (C) An action potential generated in an M-cell drove the recorded i-Ta2 and c-Ta2 neurons to discharge a single action potential, which decreased to an EPSP in both i-Ta2 and c-Ta2 neurons in the presence of tubocurarine, and EPSPs in both neurons persisted in cadmium. (D) Average data show that there was a statistical difference between control and tubocurarine groups (Student’s t test; n = 5 for both i-Ta1 and c-Ta1 neurons) between control and cadmium groups (Student’s t test; n = 5 for both i-Ta1 and c-Ta1 neurons). There was no significant difference between tubocurarine and cadmium groups (Student’s t test; n = 5 for both i-Ta1 and c-Ta1 neurons). (E) Mean data show that there was a statistical difference between control and tubocurarine groups (Student’s t test; n = 5 for both i-Ta2 and c-Ta2 neurons) and between control and cadmium groups (Student’s t test; n = 5 for both i-Ta2 and c-Ta2 neurons). There was no significant difference between tubocurarine and cadmium groups (Student’s t test; n = 5 for both i-Ta2 and c-Ta2 neurons). (F) Immunofluorescent images showing SV2 protein expressed at the cross sites formed by Ta1 (upper) and Ta2 (lower) neuron axon with both M-cell axons. White arrows indicate the axo-axonic contact positions positive for SV2 antibody. (G) Line drawing showing the paired whole-cell, patch-clamp recording between i-Ta1 and c-Ta1 neurons. (H and I) The single action potential generated in i-Ta1 or c-Ta1 neurons induced EPSPs in counterpart neurons, which were completely blocked by tubocurarine. (J and K) The statistic graphs showing that tubocurarine significantly abolished the EPSPs generated in the c-Ta1 or i-Ta1 neurons (Student’s t test; n = 5). (L) Drawing illustrating the paired whole-cell, patch-clamp recording between i-Ta2 and c-Ta2 neurons. (M and N) The single action potential generated in i-Ta2 or c-Ta2 neurons induced EPSPs in the counterpart neurons, which were completely blocked by tubocurarine. (O and P) Average data show that tubocurarine significantly reduced the EPSPs generated in the c-Ta2 or i-Ta2 neurons (Student’s t test; n = 5). (Q) Line drawing illustrating the paired whole-cell, patch-clamp recording between i-Ta1 and i-Ta2 neurons. (R and S) A single action potential generated in i-Ta1 or i-Ta2 neurons induced EPSPs in counterpart neurons, which were partially blocked by tubocurarine. The EPSPs remaining in tubocurarine were unaffected by addition of cadmium. (T and U) Average data show that tubocurarine significantly decreased the EPSPs generated in the c-Ta1 or i-Ta1 neurons (Student’s t test; n = 5). The amplitude of EPSPs in cadmium group was significantly different from control group (Student’s t test; n = 5) and was not significantly different from tubocurarine group (Student’s t test, n = 5). Blue traces represent ipsilateral neurons, and purple traces represent contralateral neurons; ∗∗∗∗p < 0.0001; ∗∗∗p < 0.001. |

Cranial relay neurons excited the neurons in contralateral nMLF (A and B) Line drawings illustrate the dual whole-cell, patch-clamp recording from i-Ta1 and i-Ta2 neurons and neurons in contralateral nMLF. (C and D) A single action potential generated in i-Ta1 (C) or Ta2 (D) neurons induced discharge of action potentials in MeLr, MeLc, MeLm, MeS-P, and MeS-T neurons but only EPSPs in MeM as well as MeS-N neurons at the contralateral nMLF. Application of tubocurarine completely abolished the firing of these neurons. (E and F) Raster plot of the representative Ta1 (E) and Ta2 (F) neurons activation induced transient action potential firing pattern for MeLr (n = 7 for each), MeLc (n = 6 for each), MeLm (n = 7 for each), and MeS-T (n = 6 for each) neurons; the persistent discharge of action potentials in MeS-P neurons (n = 6 for each); and lack of action potentials in MeM (n = 4) and MeS-N (n = 6) neurons in the contralateral nMLF. The red vertical line indicates the spike timing of Ta1 and Ta2 neuron’s action potential. (G and H) The drawing (left panel) shows the morphology of a i-Ta1 and i-Ta2 neuron and their contralateral MeLr and MeS-P neuron revealed by intracellular neurobiotin staining. The confocal images (right panels) show SV2 protein expression at the crossing sites between axon of the i-Ta1 and i-Ta2 neuron and dendrites and axon of the MeLr and MeS-P neuron. The dashed blue line indicates the axon of the Ta1 and Ta2 neuron, and the dashed purple line indicates the dendrites and axon of the MeLr and MeS-P neuron. The white arrows indicate the location of SV2 protein and the crossing sites. (I–M) Average data show number of action potentials induced by M-cell and Ta1 and Ta2 stimulations generated in bilateral MeLr, MeLc, MeLm, MeS-P, and MeS-T neurons of nMLF. Blue and purple represent the ipsilateral and contralateral locations, respectively (one-way ANOVA). Each dot represents a single neuron; ∗∗∗p < 0.001. See also Figure S2. |
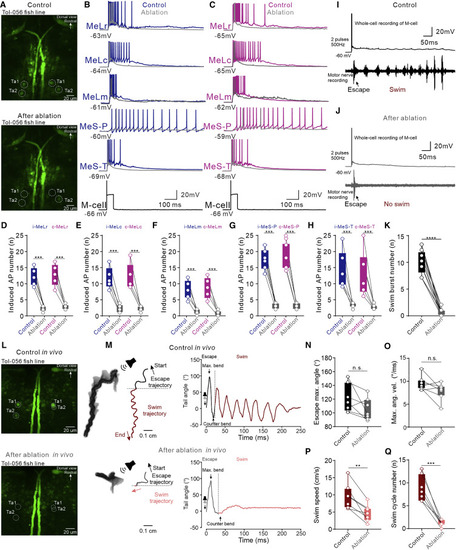
Laser ablation of CRNs ex vivo and in vivo impaired the swim activity during defensive motor sequence (A) Two-photon images taken before and after laser ablation of Ta1 and Ta2 at both sides of the hindbrain in a Tg(Tol-056) ex vivo preparation. (B and C) A single action potential in an M-cell induced discharge of action potentials in MeLr, MeLc, MeLm, MeS-P, and MeS-T neurons at both ipsilateral (blue traces in B) and contralateral (purple traces in C) nMLF. Laser ablation of ipsilateral and contralateral Ta1 and Ta2 neurons largely decreased the number of action potentials generated in these neurons, as indicated by the gray curves. (D–H) Mean data show the number of action potentials generated in the ipsilateral and contralateral MeLr, MeLc, MeLm, MeS-P, and MeS-T neurons by M-cell stimulation was significantly less after laser ablation of CRNs (Student’s t test; n = 5 neurons in each group). (I) Recording of a control ex vivo preparation showing that M-cell stimulation triggered a typical defensive motor sequence of escape and swim. (J) Laser ablation of CRNs abolished the swim behavior of the defensive motor sequence in the same preparation shown in (I). (K) Mean data showing the difference in swim burst number between control and laser ablation groups (Student’s t test; n = 6 fish). (L) Two-photon microscope images before and after laser ablation of Ta1 and Ta2 at both sides of the hindbrain in a freely swimming Tg(Tol-056) fish. (M) The movement trajectories of a defensive motor sequence in a freely swimming animal induced by sound stimulation before and after laser ablation of CRNs (left panels). Plots on the right panels show the real-time tail bending angles. (N–Q) Mean data show that the control group and after ablation group did not differ significantly in terms of escape maximal tail bending angle and maximal angle velocity (n = 7 fish) but differed significantly in swim cycle number (Student’s t test; n = 7 fish) and swim speed (Student’s t test; n = 7 fish). Blue and purple represent the ipsilateral and contralateral locations, respectively. ∗∗∗∗p < 0.0001; ∗∗∗p < 0.001; ∗∗p < 0.01. See also Figure S3 and Videos S3 and S4. |