
Fig. 7
- ID
- ZDB-FIG-220729-7
- Publication
- Xu et al., 2021 - A neuronal circuit that generates the temporal motor sequence for the defensive response in zebrafish larvae
- Other Figures
- All Figure Page
- Back to All Figure Page
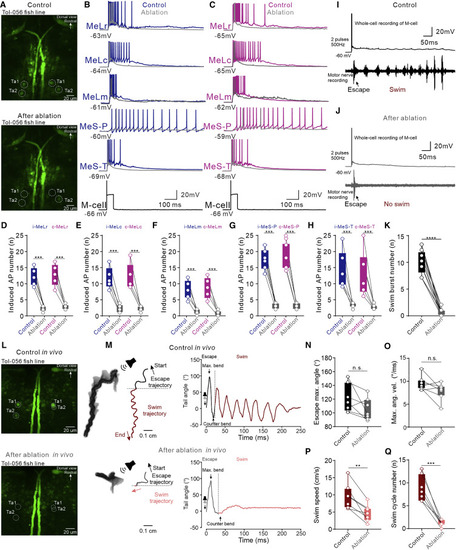
Laser ablation of CRNs ex vivo and in vivo impaired the swim activity during defensive motor sequence (A) Two-photon images taken before and after laser ablation of Ta1 and Ta2 at both sides of the hindbrain in a Tg(Tol-056) ex vivo preparation. (B and C) A single action potential in an M-cell induced discharge of action potentials in MeLr, MeLc, MeLm, MeS-P, and MeS-T neurons at both ipsilateral (blue traces in B) and contralateral (purple traces in C) nMLF. Laser ablation of ipsilateral and contralateral Ta1 and Ta2 neurons largely decreased the number of action potentials generated in these neurons, as indicated by the gray curves. (D–H) Mean data show the number of action potentials generated in the ipsilateral and contralateral MeLr, MeLc, MeLm, MeS-P, and MeS-T neurons by M-cell stimulation was significantly less after laser ablation of CRNs (Student’s t test; n = 5 neurons in each group). (I) Recording of a control ex vivo preparation showing that M-cell stimulation triggered a typical defensive motor sequence of escape and swim. (J) Laser ablation of CRNs abolished the swim behavior of the defensive motor sequence in the same preparation shown in (I). (K) Mean data showing the difference in swim burst number between control and laser ablation groups (Student’s t test; n = 6 fish). (L) Two-photon microscope images before and after laser ablation of Ta1 and Ta2 at both sides of the hindbrain in a freely swimming Tg(Tol-056) fish. (M) The movement trajectories of a defensive motor sequence in a freely swimming animal induced by sound stimulation before and after laser ablation of CRNs (left panels). Plots on the right panels show the real-time tail bending angles. (N–Q) Mean data show that the control group and after ablation group did not differ significantly in terms of escape maximal tail bending angle and maximal angle velocity (n = 7 fish) but differed significantly in swim cycle number (Student’s t test; n = 7 fish) and swim speed (Student’s t test; n = 7 fish). Blue and purple represent the ipsilateral and contralateral locations, respectively. ∗∗∗∗p < 0.0001; ∗∗∗p < 0.001; ∗∗p < 0.01. See also Figure S3 and Videos S3 and S4. |