
Fig. 2
- ID
- ZDB-IMAGE-220729-2
- Publication
- Xu et al., 2021 - A neuronal circuit that generates the temporal motor sequence for the defensive response in zebrafish larvae
- All Figures
- Figures for Xu et al., 2021
|
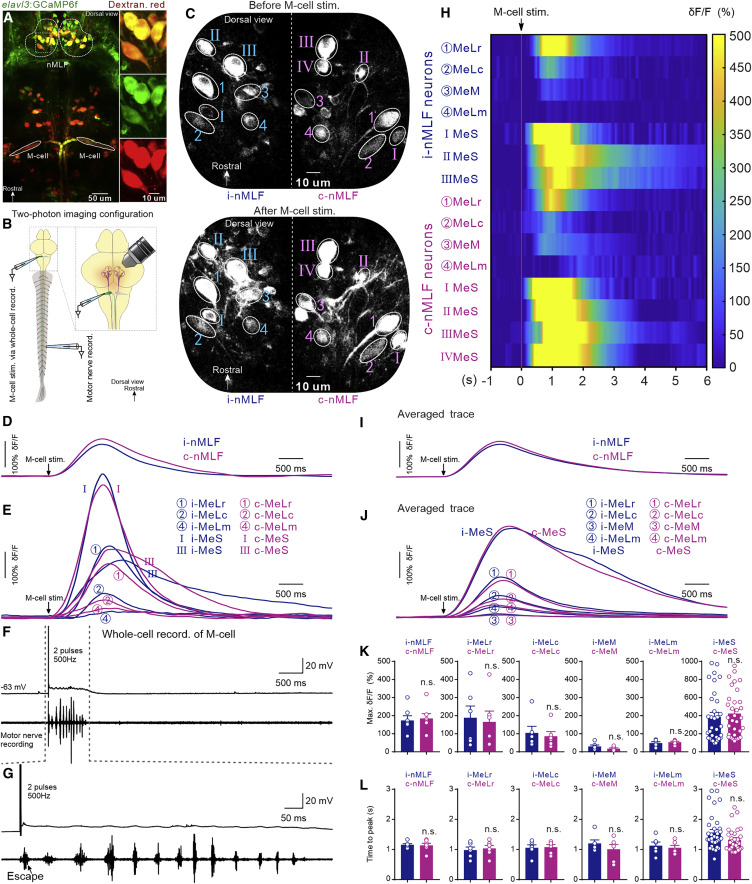
Fig. 2 Unilateral M-cell activation recruited neurons in bilateral nMLF during defensive motor sequence (A) Retrograde labeling of neurons in nMLF by rhodamine dextran in the Tg (elavl3: GCaMP6f) fish line. Descending neurons in nMLF express both green and red fluorescence. (B) The experimental configuration of two-photon calcium imaging with simultaneous whole-cell, patch-clamp recording of M-cells and recording of tail motor nerve activity. (C) Images showing GCaMP6f fluorescence intensity in neurons of bilateral nMLF before M-cell stimulation (upper panel) and after M-cell stimulation (lower panel). (D–F) Typical traces illustrating the dynamic response of calcium change in the ipsilateral (blue) and contralateral (purple) nMLF (D) and MeLr, MeLc, MeLm, and MeS neurons of bilateral nMLF (E) when M-cell activation (F, top) induced a defensive motor sequence recorded from the tail motor nerve (F, bottom). (G) Enlargement of the region of the trace bounded by the dash lines in (F). The black arrow shows the escape burst. (H) Heatmap of the calcium responses of neurons shown in (C)–(F). (I) Average calcium response curves from seven experiments of neurons in ipsilateral and contralateral nMLF during M-cell-activation-induced defensive motor sequence. Black arrow indicates when action potentials were generated in M-cell. (J) Average calcium responses of MeLr, MeLc, MeM, MeLm, and MeS neurons of bilateral nMLF during M-cell-activation-induced defensive motor sequence. Black arrow indicates when action potentials were generated in M-cell. (K) There were no significant differences in the maximum amplitude of calcium responses in ipsilateral neurons and its contralateral counterparts (Student’s t test; n = 6 fish; each dot represents one neuron for all groups). (L) There was no significant difference in the time to peak calcium response in ipsilateral neurons and its contralateral counterparts (Student’s t test; n = 6 fish; each dot represents one neuron for all groups). Blue traces and bars represent ipsilateral neurons; purple traces and bars represent contralateral neurons. All graphs show mean ± SEM, and each circle shows individual neurons from different preparation; n.s. represents no significant difference.