
Fig. 1
- ID
- ZDB-FIG-220729-1
- Publication
- Xu et al., 2021 - A neuronal circuit that generates the temporal motor sequence for the defensive response in zebrafish larvae
- Other Figures
- All Figure Page
- Back to All Figure Page
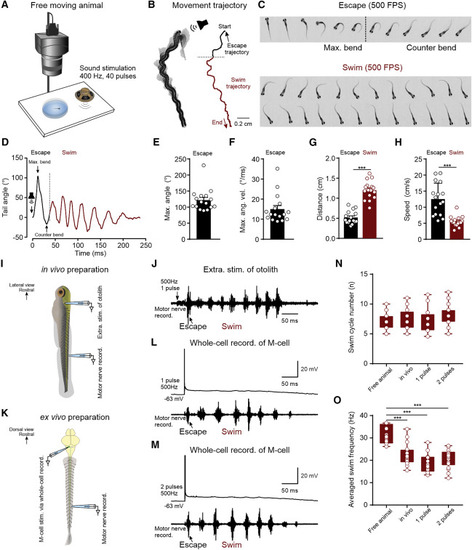
The single M-cell-activation-induced defensive motor sequence led by initial escape and transited to subsequent swim (A) Experimental setup for monitoring the sound-induced defensive motor sequence via a high-speed camera (500 fps). (B) The illustrated movement trajectory of a video-recorded 12-dpf zebrafish defensive motor sequence induced by sound stimulation, containing two continuous behaviors, escape (black trace) and swim (red trace). The black arrow indicates the initial head direction, and the red arrow represents the heading direction at the end of the movement. (C) Illustration of dynamic body images of escape behavior (every frame) and swim behavior (every other frame) during the defensive motor sequence in (B). Each frame represents 2 ms. (D) The plot exhibiting the real-time tail bending angles of the defensive motor sequence in (B). (E and F) Average maximal tail bending angle (E) and average maximal tail angular velocity (F; n = 16 fish). (G and H) Distance traveled (G) and movement speed (H) of the escape and swim behaviors during defensive motor sequence (Student’s t test; n = 16 fish for both G and H). (I) Drawing illustrating the extracellular stimulation of otolith and extracellular motor nerve recording in the in vivo preparation. (J) Stimulation of otolith in the in vivo preparation induced a defensive motor sequence consisting of the initial escape and the following swim activity. The black arrow indicates escape burst. (K) Drawing illustrating the whole-cell recording in an M-cell and extracellular motor nerve recording in the ex vivo preparation. (L) One action potential in an M-cell induced a defensive motor sequence of escape and swim. Black arrow indicates the escape burst. (M) Two action potentials generated in M-cell induced a similar defensive motor sequence of escape and swim. Black arrow indicates the escape burst. (N) Average swim cycle during the defensive motor sequence for freely moving animals, in vivo preparations, 1 pulse stimulation of M-cells, and 2 pulses stimulation of M-cells (one-way ANOVA; n = 16 fish for free animal; n = 18 fish for in vivo; n = 24 fish for both 1 pulse and 2 pulses). (O) Average swim frequency of swim activity during the defensive motor sequence for free-moving animals and in vivo preparations, 1 pulse stimulation of M-cells, and 2 pulses stimulation of M-cells (one-way ANOVA; n = 16 fish for free animal; n = 18 fish for in vivo; n = 24 fish for both 1 pulse and 2 pulses). All graphs show mean ± SEM, and circles show individual data points; ∗∗∗p < 0.001. |