
Fig. 6
- ID
- ZDB-IMAGE-220729-6
- Publication
- Xu et al., 2021 - A neuronal circuit that generates the temporal motor sequence for the defensive response in zebrafish larvae
- All Figures
- Figures for Xu et al., 2021
|
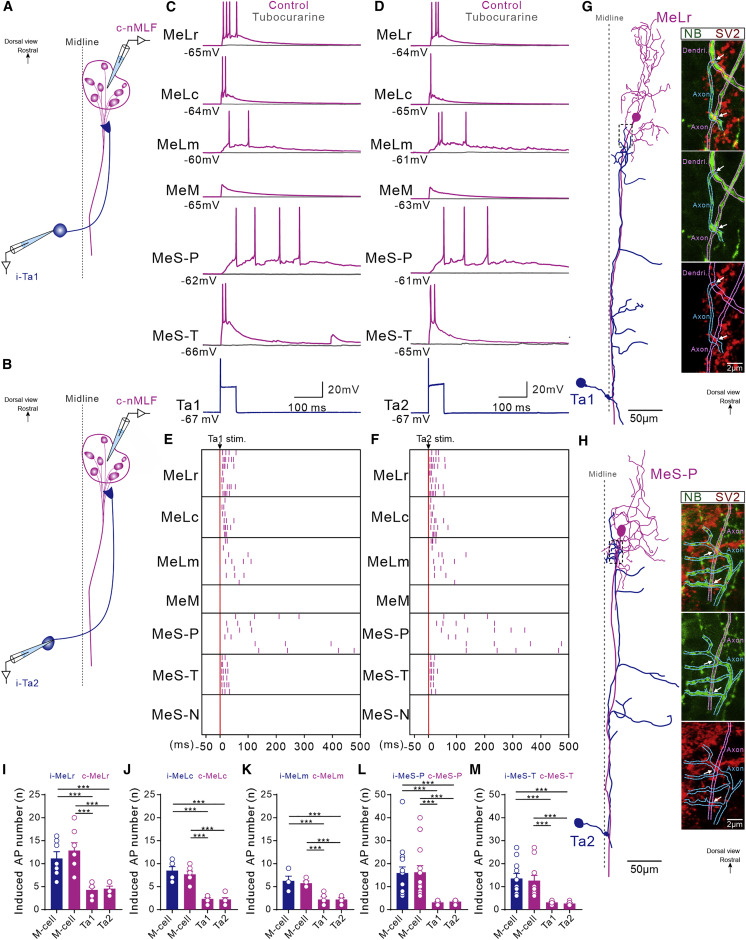
Fig. 6 Cranial relay neurons excited the neurons in contralateral nMLF (A and B) Line drawings illustrate the dual whole-cell, patch-clamp recording from i-Ta1 and i-Ta2 neurons and neurons in contralateral nMLF. (C and D) A single action potential generated in i-Ta1 (C) or Ta2 (D) neurons induced discharge of action potentials in MeLr, MeLc, MeLm, MeS-P, and MeS-T neurons but only EPSPs in MeM as well as MeS-N neurons at the contralateral nMLF. Application of tubocurarine completely abolished the firing of these neurons. (E and F) Raster plot of the representative Ta1 (E) and Ta2 (F) neurons activation induced transient action potential firing pattern for MeLr (n = 7 for each), MeLc (n = 6 for each), MeLm (n = 7 for each), and MeS-T (n = 6 for each) neurons; the persistent discharge of action potentials in MeS-P neurons (n = 6 for each); and lack of action potentials in MeM (n = 4) and MeS-N (n = 6) neurons in the contralateral nMLF. The red vertical line indicates the spike timing of Ta1 and Ta2 neuron’s action potential. (G and H) The drawing (left panel) shows the morphology of a i-Ta1 and i-Ta2 neuron and their contralateral MeLr and MeS-P neuron revealed by intracellular neurobiotin staining. The confocal images (right panels) show SV2 protein expression at the crossing sites between axon of the i-Ta1 and i-Ta2 neuron and dendrites and axon of the MeLr and MeS-P neuron. The dashed blue line indicates the axon of the Ta1 and Ta2 neuron, and the dashed purple line indicates the dendrites and axon of the MeLr and MeS-P neuron. The white arrows indicate the location of SV2 protein and the crossing sites. (I–M) Average data show number of action potentials induced by M-cell and Ta1 and Ta2 stimulations generated in bilateral MeLr, MeLc, MeLm, MeS-P, and MeS-T neurons of nMLF. Blue and purple represent the ipsilateral and contralateral locations, respectively (one-way ANOVA). Each dot represents a single neuron; ∗∗∗p < 0.001. See also Figure S2.