
Fig. 5
- ID
- ZDB-FIG-220729-5
- Publication
- Xu et al., 2021 - A neuronal circuit that generates the temporal motor sequence for the defensive response in zebrafish larvae
- Other Figures
- All Figure Page
- Back to All Figure Page
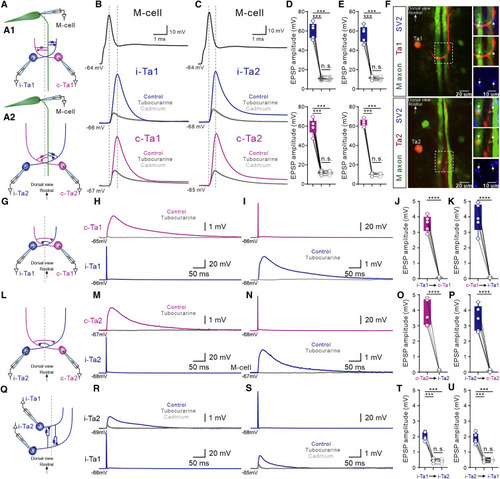
Cranial relay neurons were interconnected to form an excitatory feedforward circuit (A) Line drawing showing the triple whole-cell, patch-clamp recording in M-cell, i-Ta1, and c-Ta1 neurons (A1) or M-cell, i-Ta2, and c-Ta2 neurons (A2). (B) An action potential generated in the recorded M-cell drove the recorded i-Ta1 and c-Ta1 neurons to discharge a single action potential, which were decreased to EPSPs in both i-Ta1 and c-Ta1 neurons in the presence of tubocurarine. EPSPs in both neurons persisted in cadmium (gray). (C) An action potential generated in an M-cell drove the recorded i-Ta2 and c-Ta2 neurons to discharge a single action potential, which decreased to an EPSP in both i-Ta2 and c-Ta2 neurons in the presence of tubocurarine, and EPSPs in both neurons persisted in cadmium. (D) Average data show that there was a statistical difference between control and tubocurarine groups (Student’s t test; n = 5 for both i-Ta1 and c-Ta1 neurons) between control and cadmium groups (Student’s t test; n = 5 for both i-Ta1 and c-Ta1 neurons). There was no significant difference between tubocurarine and cadmium groups (Student’s t test; n = 5 for both i-Ta1 and c-Ta1 neurons). (E) Mean data show that there was a statistical difference between control and tubocurarine groups (Student’s t test; n = 5 for both i-Ta2 and c-Ta2 neurons) and between control and cadmium groups (Student’s t test; n = 5 for both i-Ta2 and c-Ta2 neurons). There was no significant difference between tubocurarine and cadmium groups (Student’s t test; n = 5 for both i-Ta2 and c-Ta2 neurons). (F) Immunofluorescent images showing SV2 protein expressed at the cross sites formed by Ta1 (upper) and Ta2 (lower) neuron axon with both M-cell axons. White arrows indicate the axo-axonic contact positions positive for SV2 antibody. (G) Line drawing showing the paired whole-cell, patch-clamp recording between i-Ta1 and c-Ta1 neurons. (H and I) The single action potential generated in i-Ta1 or c-Ta1 neurons induced EPSPs in counterpart neurons, which were completely blocked by tubocurarine. (J and K) The statistic graphs showing that tubocurarine significantly abolished the EPSPs generated in the c-Ta1 or i-Ta1 neurons (Student’s t test; n = 5). (L) Drawing illustrating the paired whole-cell, patch-clamp recording between i-Ta2 and c-Ta2 neurons. (M and N) The single action potential generated in i-Ta2 or c-Ta2 neurons induced EPSPs in the counterpart neurons, which were completely blocked by tubocurarine. (O and P) Average data show that tubocurarine significantly reduced the EPSPs generated in the c-Ta2 or i-Ta2 neurons (Student’s t test; n = 5). (Q) Line drawing illustrating the paired whole-cell, patch-clamp recording between i-Ta1 and i-Ta2 neurons. (R and S) A single action potential generated in i-Ta1 or i-Ta2 neurons induced EPSPs in counterpart neurons, which were partially blocked by tubocurarine. The EPSPs remaining in tubocurarine were unaffected by addition of cadmium. (T and U) Average data show that tubocurarine significantly decreased the EPSPs generated in the c-Ta1 or i-Ta1 neurons (Student’s t test; n = 5). The amplitude of EPSPs in cadmium group was significantly different from control group (Student’s t test; n = 5) and was not significantly different from tubocurarine group (Student’s t test, n = 5). Blue traces represent ipsilateral neurons, and purple traces represent contralateral neurons; ∗∗∗∗p < 0.0001; ∗∗∗p < 0.001. |