FIGURE SUMMARY
Title

Congenital Asplenia Interrupts Immune Homeostasis and Leads to Excessive Systemic Inflammation in Zebrafish

Authors
Xie, L., Chen, Z., Guo, H., Tao, Y., Miao, X., Wu, R., Li, Y.
Source
Full text @ Front Cell Infect Microbiol

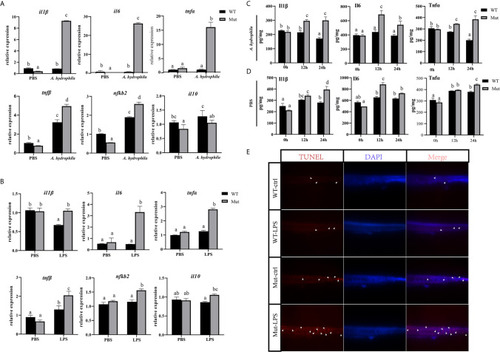
Effects of congenital asplenia on inflammatory response in zebrafish larvae. (A) The expression of inflammatory response–related genes after pathogenic A. hydrophila infection in zebrafish larvae. (B) The expression of inflammatory response–related genes after LPS exposure. (C, D) The expression of Il1β, Il6, and Tnfα proteins after A. hydrophila challenge and LPS by ELISA. (E) A high aggregation of apoptotic cells was observed in the trunk of congenitally asplenic zebrafish by TUNEL assay. The white arrowhead indicates TUNEL-positive cells. Different letters (a, b, c, etc.) indicate significant differences (p < .05).

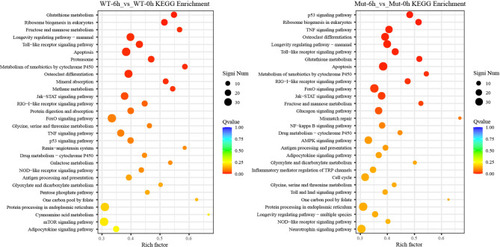
The top 30 enriched KEGG pathways in WT-6h_vs_WT-0h and Mut-6h_vs_Mut-0h. The color and size of the dots indicate Q-values and DEG numbers in pathways, respectively.

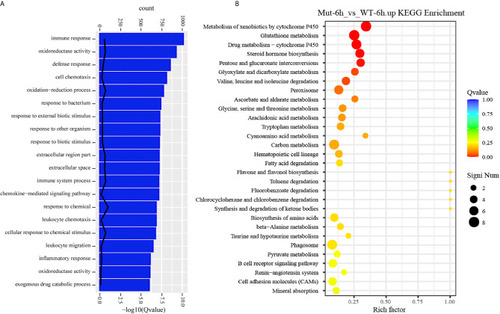
GO functional enrichment and KEGG analysis from upregulated DEGs in Mut-6h_vs_WT-6h. (A) The top 20 significantly upregulated GO categories in Mut-6h_vs_WT-6h. The X- and Y-axes represent the significantly enriched GO terms and the corresponding number of DEGs, respectively. (B) The top 30 upregulated KEGG pathways in Mut-6h_vs_WT-6h. The numbers of DEGs in each pathway are counted and rich factors and P-values are displayed.

Congenital asplenia induces excessive systemic inflammation after vaccination in zebrafish. (A) The expression level of inflammatory cytokines/chemokines displayed with a heat map. (B) The expression of inflammation-related genes in liver after vaccination by qRT-PCR. (C) The expression of inflammation-related genes in intestine after vaccination by qRT-PCR. (D) The expression level of other important immune-related genes by RNA-seq. Different letters (a, b, c, etc.) indicate significant differences (p < .05).

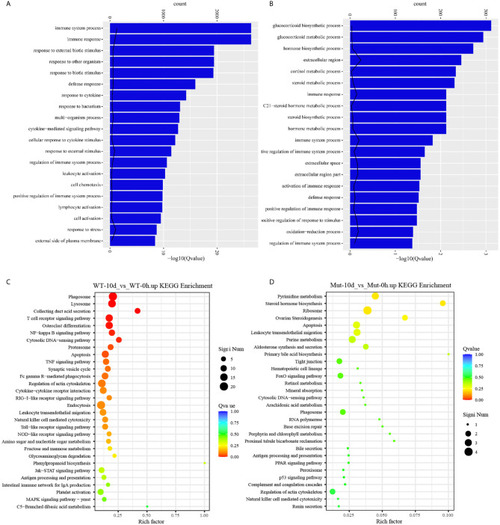
GO functional enrichment and KEGG analysis from upregulated DEGs in WT-10d_vs_WT-0h and Mut-10d_vs_Mut-0h. (A, B) The top 20 significantly upregulated GO categories in WT-10d_vs_WT-0h and Mut-10d_vs_Mut-0h, respectively. The X- and Y-axes represent the significantly enriched GO terms and the corresponding number of DEGs, respectively. (C, D) The top 30 upregulated KEGG pathways in WT-10d_vs_WT-0h and Mut-10d_vs_Mut-0h, respectively. The numbers of DEGs in each pathway are counted, and rich factors and P-values are displayed.

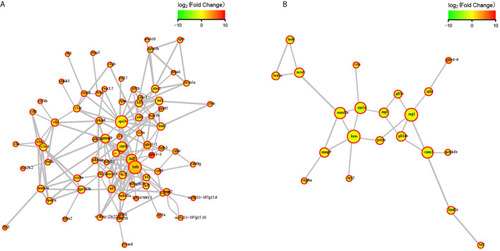
STRING network analysis on DEGs annotated in GO: immune system process. (A) WT-10d_vs_WT-0h. (B) Mut-10d_vs_Mut-0h. The nod represents proteins, bigger means more interaction with others. The red color means upregulated DEGs, and the green means downregulated DEGs.

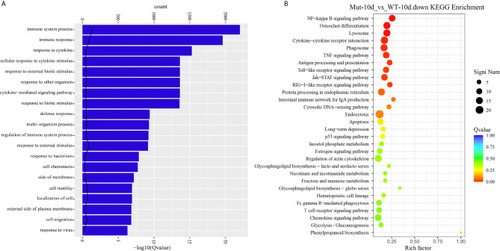
GO functional enrichment and KEGG analysis from downregulated DEGs in Mut-10d_vs_WT-10d. (A) The top 20 significantly downregulated GO categories in Mut-10d_vs_WT-10d. The X- and Y-axes represent the significantly enriched GO terms and the corresponding number of DEGs, respectively. (B) The top 30 downregulated KEGG pathways in Mut-10d_vs_WT-10d. The numbers of DEGs in each pathway are counted, and rich factors and P-values are displayed.

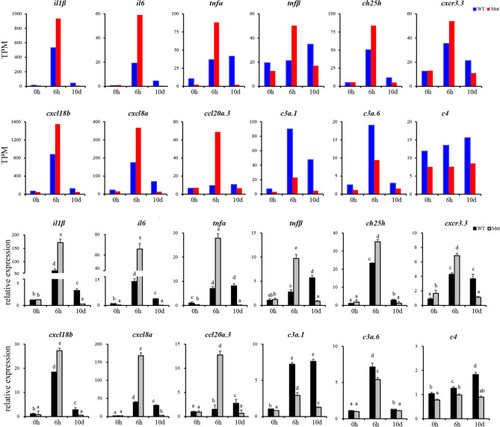
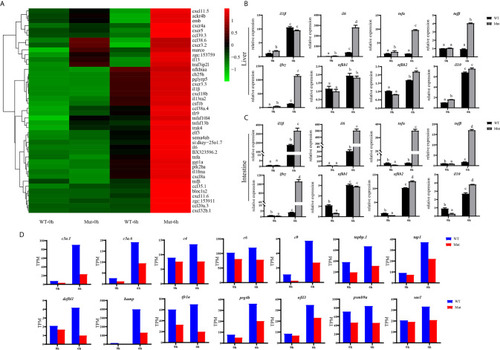
Validation of the 12 DEGs by qRT-PCR. WT animals and congenitally asplenic zebrafish sampled at 0 h were used as controls. The data were normalized to the expression level of WT-0h. The data are reported as the mean ± SEM. Different letters (a, b , c etc.) indicate significant differences (p <.05).

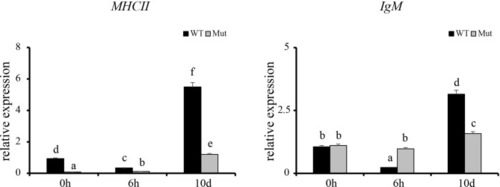
Expression profiles of MHCII and IgM after vaccination in whole kidneys. WT animals and congenitally asplenic zebrafish sampled at 0 h were used as controls. The data were normalized to the expression level of WT-0h. The data are reported as the mean ± SEM. Different letters (a, b, c, etc.) indicate significant differences (p < .05).

Acknowledgments
This image is the copyrighted work of the attributed author or publisher, and ZFIN has permission only to display this image to its users. Additional permissions should be obtained from the applicable author or publisher of the image. Full text @ Front Cell Infect Microbiol