
IMAGE
Figure 9
- ID
- ZDB-IMAGE-210717-15
- Genes
- Publication
- Xie et al., 2021 - Congenital Asplenia Interrupts Immune Homeostasis and Leads to Excessive Systemic Inflammation in Zebrafish
- All Figures
- Figures for Xie et al., 2021
Image
|
Figure Caption
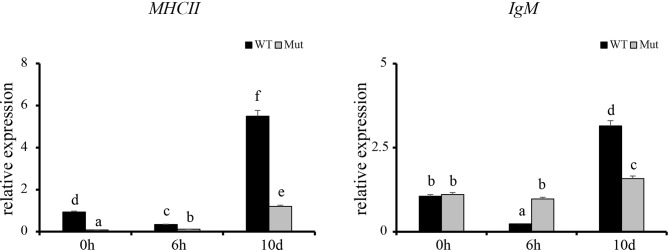
Figure 9
Expression profiles of
Figure Data
Acknowledgments
This image is the copyrighted work of the attributed author or publisher, and
ZFIN has permission only to display this image to its users.
Additional permissions should be obtained from the applicable author or publisher of the image.
Full text @ Front Cell Infect Microbiol