
- Title
-
Carbofuran affects cellular autophagy and developmental senescence through the impairment of Nrf2 signalling
- Authors
- Khan, A., Zaman, T., Fahad, T.M., Akther, T., Hasan, M.F., Naz, T., Kishi, S.
- Source
- Full text @ J. Cell. Mol. Med.

Carbofuran exacerbates cellular senescence and shortens lifespan. (A) Based on the magnitude of opaqueness, the yolk opaqueness was sorted as partially opaque (marked by yellow colour) and mostly opaque (marked by red colour). Fish (wild type; spns1+/+ or heterozygote; spns1±) did not show opaqueness phenotype was marked by black colour. (B) The effect of carbofuran exposure on senescence phenotype (yolk opacity) of spns1-mutant zebrafish. In the cases of carbofuran-treated spns1-mutant zebrafish, both partially and mostly opaque phenotypes were found at earlier times than mutant zebrafish of the control group (egg water treatment). In addition, carbofuran treatment leads mutant zebrafish to die at quicker times than fish of the control group. (C) Survival (in hours) of spns1-mutant embryos has been shortened (P = .0003) upon exposure to carbofuran. (D) Survival (in months) of wild zebrafish was shortened (P < .0007) upon exposure to carbofuran. (E) Carbofuran accelerates SA-β-gal activity in both wild-type (spns1+/+) and spns1-mutant (spns1−/−) zebrafish. Carbofuran did not affect morphological phenotype (MP) of wild fish but affected yolk opaqueness of spns1-mutant fish (black arrowhead in the first row). SA-β-gal–stained fish have shown in the second row. The cellular SA-β-gal staining at dorsal to the eye has shown in the third row. (F) Quantification of dark blue particles of SA-β-gal staining of whole fish. The scale bar is 250 μm (stereo microscopic images) and 10 μm (confocal microscopic images). The number of fish was 10 (n = 10). Data are presented as mean ± SE. *P ≤ .05; ***P ≤ .005 |
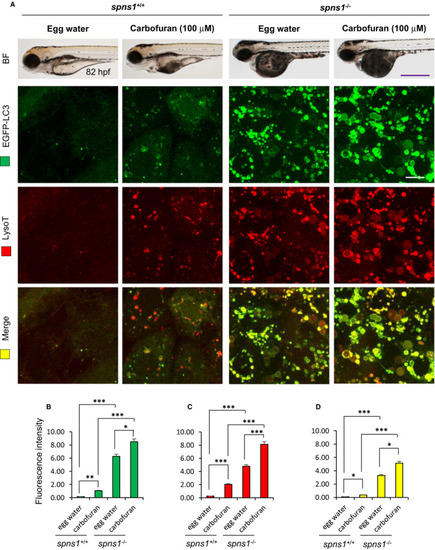
Carbofuran affects autophagy through autolysosomal protein accumulation. (A) Carbofuran affects autophagy in both wild-type and spns1-mutant fish. The top panel is the observation under the bright field condition of the stereo-microscope. The second (EGFP-LC3) and third (LysoTracker Red) panels were observed under fluorescence conditions of the confocal microscope (head region, dorsal to the eye). Merged images (yellow) have shown in the bottom panel. (B) Alteration of autophagosomal expression by carbofuran treatment. In both wild and spns1-mutant zebrafish, carbofuran treatment significantly increased autophagosomal EGFP-LC3 expression. (C) Alteration in lysosomal expression by carbofuran treatment. In both wild and spns1-mutant zebrafish, carbofuran treatment significantly increased lysosomal LysoTracker Red expression. (D) Co-localization of autophagosomal EGFP and lysosomal LysoTracker Red expressions. Up-regulated autophagosomal and lysosomal expressions are significantly colocalized. Scale bar: 250 μm (stereo macro-microscopic images) and 10 μm (confocal microscopic images). The number of animals was 6 (n = 6). Data are presented as mean ± SE. *P ≤ .05; ***P ≤ .005 |
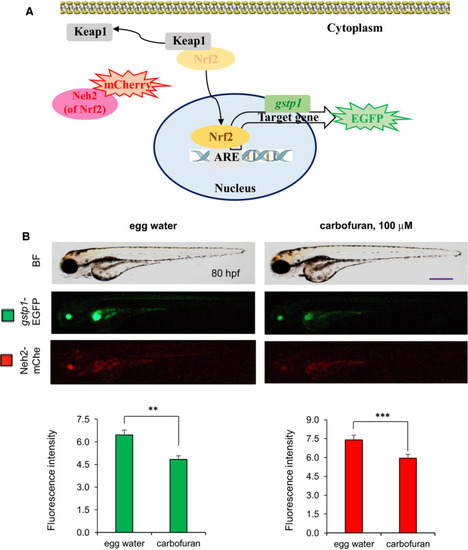
Carbofuran affects Nrf2 signalling. (A) Schematic illustration of the Nrf2-ARE signalling pathway as well as monitoring the pathway using a transgenic model. Nrf2 translocates into the nucleus by releasing Keap1. In the nucleus, Nrf2 transactivates target genes including gstp1 through binding to ARE regulatory element. The Nrf2-ARE signalling pathway was monitored using a double-transgenic zebrafish line expressing Neh2 domain (of Nrf2)-mCherry and gstp1-EGFP. (B) Effect of carbofuran on the Nrf2-ARE signalling pathway. Embryos were treated with carbofuran for 24 hours, started from 56 hpf and observed under both bright field (BF) (top row) and fluorescence conditions (bottom two rows) of the microscope. Both Neh2-mCherry and gstp1-EGFP expressions were down-regulated by carbofuran exposure. Scale bar: 250 μm. The number of animals was 10 (n = 10). Data are presented as mean ± SE. **P ≤ .01; ***P ≤ .005 |
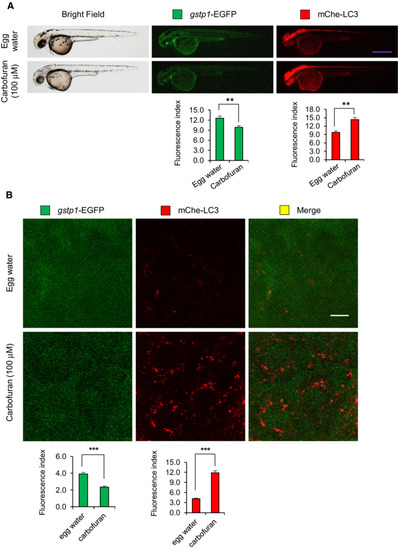
Carbofuran down-regulates Gstp1 (This is fine, no change!) expression and up-regulates autophagosomal LC3 expression. (A) The gross expressions of gstp1-EGFP and mCherry-LC3 in transgenic zebrafish under macro-microscope. Transgenic zebrafish were exposed to carbofuran for 12 hours (48 to 60 hpf). Carbofuran treatment significantly declined gstp1-EGFP expression and significantly increased autophagosomal mCherry-LC3 expression throughout the fish. Scale bar: 250 μm. (B) Cellular gstp1-EGFP and mCherry-LC3 expressions (head region, dorsal to the eye) under the confocal microscope. Like gross observation, carbofuran treatment significantly declined cellular gstp1-EGFP expression and significantly increased autophagosomal mCherry-LC3 expression. Scale bar: 10 μm. The number of animals was 8 (n = 8). Data are presented as mean ± SE. **P ≤ .01; ***P ≤ .005 |
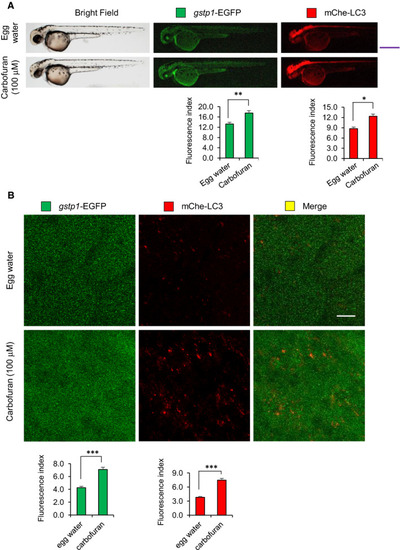
Carbofuran exposure for a short duration of time up-regulates both Gstp1 (This is fine, no change!) and autophagosomal LC3 expressions. (A) The gross expressions of gstp1-EGFP and mCherry-LC3 in transgenic zebrafish. Carbofuran treatment for a short duration of time (56 to 60 hpf) significantly increased both gstp1-EGFP and autophagosomal mCherry-LC3 expressions throughout the fish. Scale bar: 250 μm. (B) Cellular gstp1-GFP and mCherry-LC3 expressions (head region, dorsal to the eye) under the confocal microscope. Like gross observation, carbofuran treatment significantly increased both cellular gstp1-EGFP and autophagosomal mCherry-LC3 expressions. Scale bar: 10 μm. The number of animals was 8 (n = 8). Data are presented as mean ± SE. *P ≤ .05; **P ≤.01; ***P ≤ .005 |
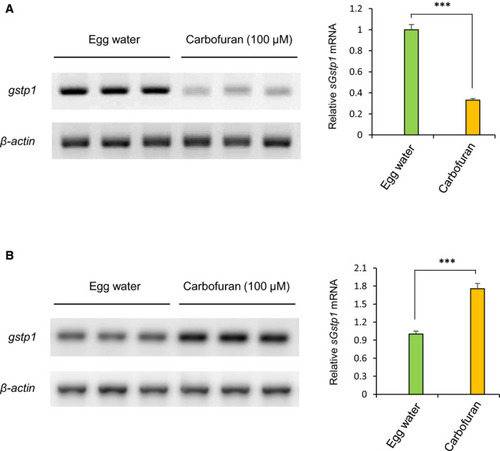
Differential regulation of gstp1 mRNA expression based on the duration of carbofuran exposure. (A) Persistent carbofuran exposure (12 hours) down-regulates the gstp1 mRNA level. B, Carbofuran exposure for a short duration of time (4 hours) up-regulates the gstp1 mRNA level. Data are mean ± SE (n = 3 samples, 3 embryos per sample). ***P ≤ .005 |
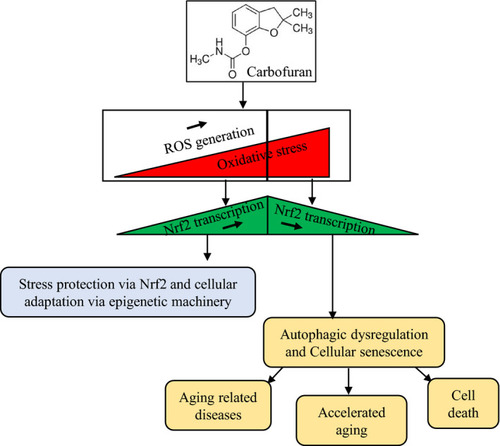
A proposed schematic model of carbofuran induced declines in biological ageing through impairment of Nrf2 signalling. Carbofuran exposure induces oxidative stress through ROS generation. At low to the medium stress conditions, cells protect themselves via Nrf2-mediated transactivation of antioxidant regulatory genes as well as through epigenetic modification. Persistent carbofuran exposure increases oxidative stress, under which the cellular protective mechanism falls and impair the Nrf2 signalling. Ultimately, the suppression of the Nrf2 signalling induces cellular senescence and affects biological ageing |