
|
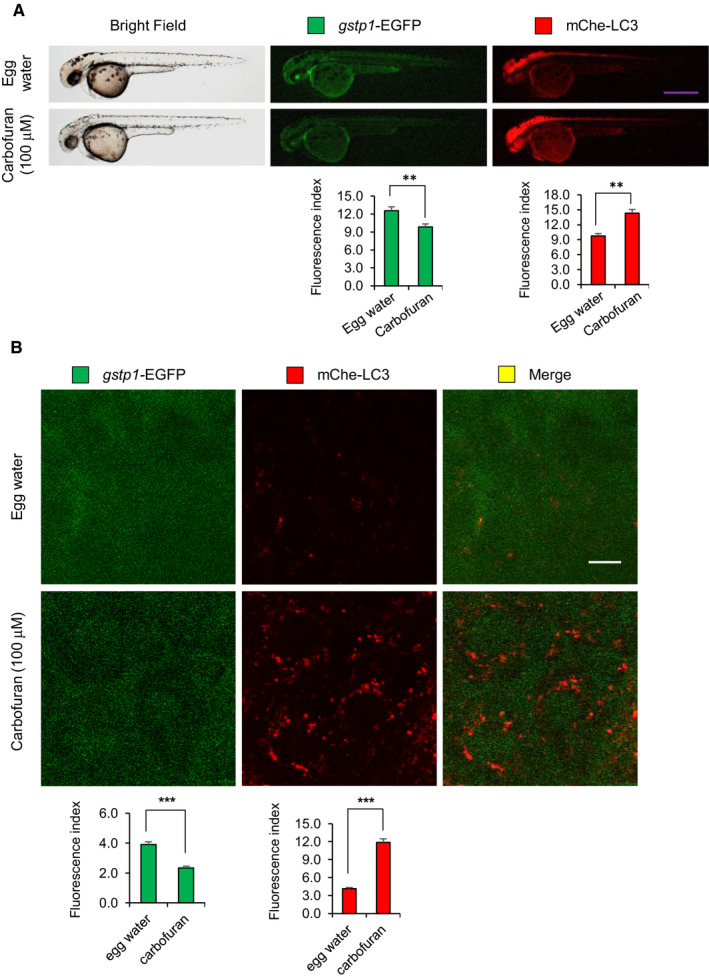
FIGURE 4 Carbofuran down-regulates Gstp1 (This is fine, no change!) expression and up-regulates autophagosomal LC3 expression. (A) The gross expressions of gstp1-EGFP and mCherry-LC3 in transgenic zebrafish under macro-microscope. Transgenic zebrafish were exposed to carbofuran for 12 hours (48 to 60 hpf). Carbofuran treatment significantly declined gstp1-EGFP expression and significantly increased autophagosomal mCherry-LC3 expression throughout the fish. Scale bar: 250 μm. (B) Cellular gstp1-EGFP and mCherry-LC3 expressions (head region, dorsal to the eye) under the confocal microscope. Like gross observation, carbofuran treatment significantly declined cellular gstp1-EGFP expression and significantly increased autophagosomal mCherry-LC3 expression. Scale bar: 10 μm. The number of animals was 8 (n = 8). Data are presented as mean ± SE. **P ≤ .01; ***P ≤ .005