
|
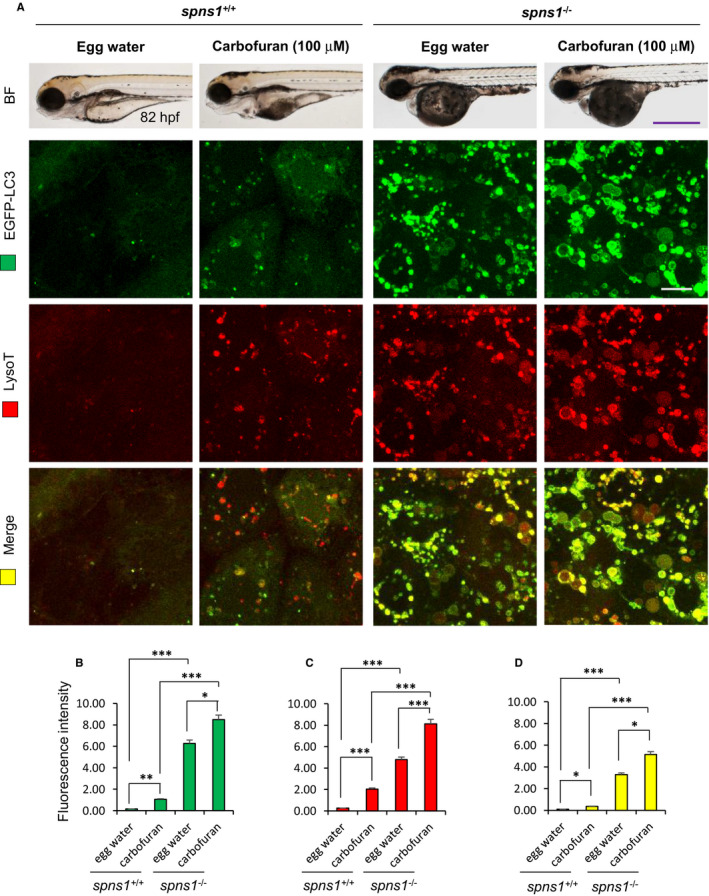
FIGURE 2 Carbofuran affects autophagy through autolysosomal protein accumulation. (A) Carbofuran affects autophagy in both wild-type and spns1-mutant fish. The top panel is the observation under the bright field condition of the stereo-microscope. The second (EGFP-LC3) and third (LysoTracker Red) panels were observed under fluorescence conditions of the confocal microscope (head region, dorsal to the eye). Merged images (yellow) have shown in the bottom panel. (B) Alteration of autophagosomal expression by carbofuran treatment. In both wild and spns1-mutant zebrafish, carbofuran treatment significantly increased autophagosomal EGFP-LC3 expression. (C) Alteration in lysosomal expression by carbofuran treatment. In both wild and spns1-mutant zebrafish, carbofuran treatment significantly increased lysosomal LysoTracker Red expression. (D) Co-localization of autophagosomal EGFP and lysosomal LysoTracker Red expressions. Up-regulated autophagosomal and lysosomal expressions are significantly colocalized. Scale bar: 250 μm (stereo macro-microscopic images) and 10 μm (confocal microscopic images). The number of animals was 6 (n = 6). Data are presented as mean ± SE. *P ≤ .05; ***P ≤ .005