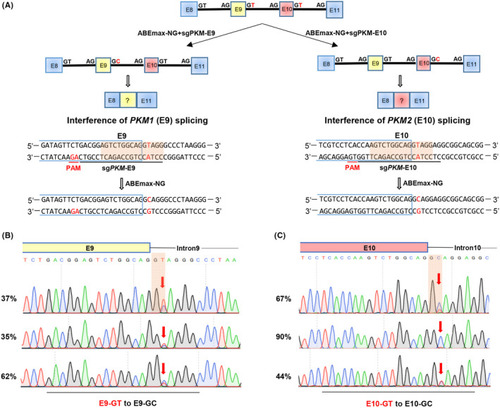
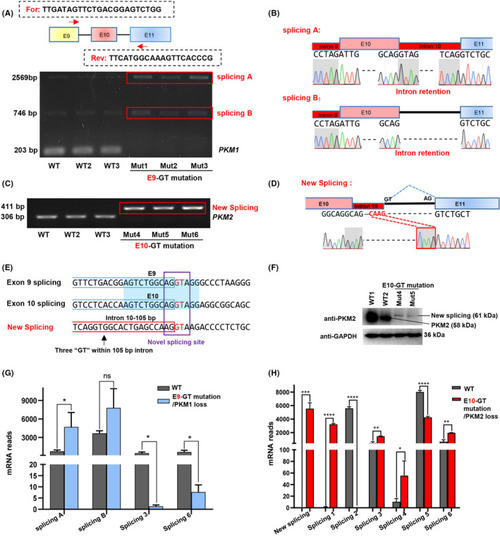
Base editing‐mediated efficient mutation of splicing junction sites of PKM gene. A, Schematic of ABEmax‐NG induced T‐to‐C in PKM gene. PKM1 contains exon 9 in yellow square, and PKM2 contains exon 10 in red square. The gRNA sequence is underlined in black and the PAM sequence is underlined in red. The targeted splicing sites are highlighted in red. B‐C. The mutation efficiencies of ABEmax‐NG‐induced T‐to‐C in E9‐GT B, or E10‐GT C, mutant cells were analysed from Sanger sequencing data using EditR

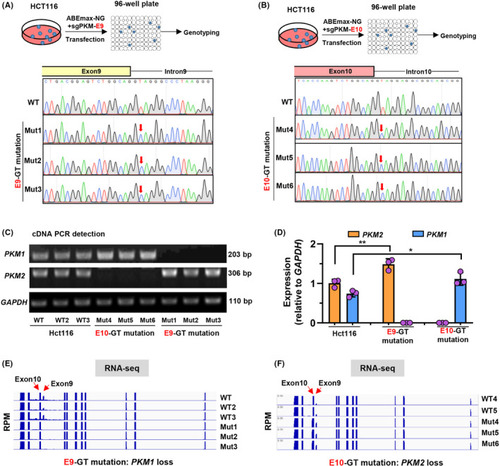
Splicing junction site mutations of PKM gene disrupt endogenous isoform‐specific gene splicing. a‐b. Schematic diagram of establishment of E9‐GT A, and E10‐GT B, mutant cell lines from single clones. The E9‐GT mutant cells were diluted and plated onto 96‐well plates for culture. After 10 d, the single clone‐derived cell lines were subjected to Sanger sequencing for genotyping. Three single clone‐derived cell lines were established for E9‐GT (Mut1‐3) and E10‐GT (Mut4‐6) mutant HCT116 cells. C, Detection of PKM1 and PKM2 expression by gel electrophoresis with expected length of PCR fragments in wild‐type (WT, WT2 and WT3), E9‐GT (Mut1‐3) and E10‐GT (Mut4‐6) mutant HCT116 cell lines. D, Semi‐quantitative analysis of PKM1 and PKM2 expression relative to GAPDH in c using ImageJ software. E‐F. Total RNA from wild‐type (WT, WT2 and WT3), E9‐GT (Mut1‐3) and E10‐GT (Mut4‐6) mutant HCT116 cell lines was subjected to RNA‐seq analysis. The enrichment of transcripts within exons or introns was presented by IGV viewer

PKM/E9‐GT mutation promotes cell growth and activates cell cycle–related gene expression. A, E9‐GT mutation promotes cell growth. CCK‐8 kit was used to analyse the cell growth of single‐clone–derived E9‐GT‐mutant cells and wild‐type HCT116 cells were used as a control. Absorbance was measured at OD450 at 0, 48 and 96 h. B, Wild‐type and E9‐GT‐mutant (PKM1 loss) cells were subjected to RNA‐seq analysis, and differentially expressed genes (upregulated and downregulated) were presented as a heatmap. Representative differentially expressed genes were also presented. C, The relative expression of differentially expressed genes was analysed from FPKM values in RNA‐seq data. The mean values from 3 single‐clone–derived E9‐GT‐mutant cell lines were shown. D, GO analysis of the differentially expressed genes upon E9‐GT mutation. E, KEGG pathway analysis of the differentially expressed genes upon E9‐GT mutation

PKM/E10‐GT mutation inhibits cell proliferation and related gene expression. A, E10‐GT mutation inhibits cell growth. CCK‐8 kit was used to analyse the cell growth of single‐clone‐derived E10‐GT‐mutant cells and wild‐type HCT116 cells served as a control. Absorbance was measured at OD450 at 0, 48 and 96 h. B, RNA‐seq analysis of differentially expressed genes in E10‐GT‐mutant cells relative to wild‐type HCT116 cells. Representative differentially expressed genes were also presented. c‐d. GO C, and KEGG D, pathway analysis of the differentially expressed genes responding to E10‐GT mutation

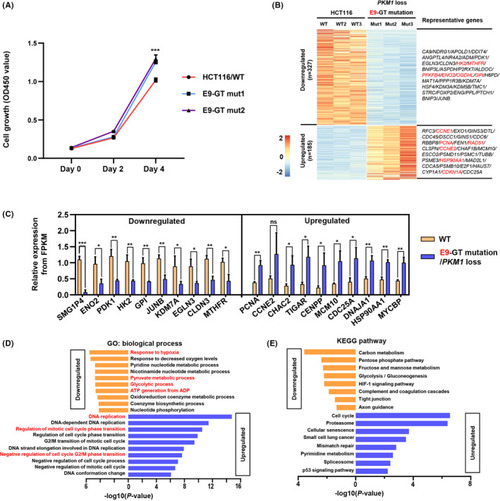
Interference of endogenous
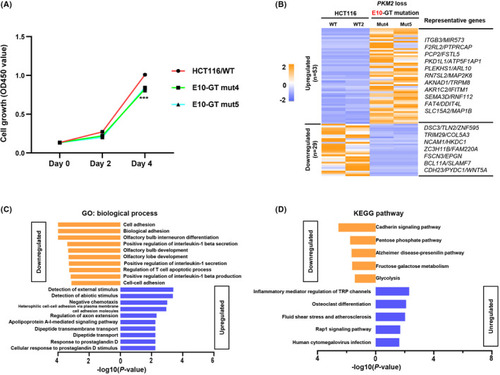
 PKM splicing generates novel splicing isoforms. A, Detection of splicing isoforms in wild‐type HCT116‐ and E9‐GT‐mutant cells. Two isoforms, defined as splicing A and B, were detected in RT‐PCR analysis. B, Analysis of DNA sequences of splicing A and B by Sanger sequencing. The intron retention was presented as red box. DNA sequences spanning the previous exons and introns were also presented. C, Detection of splicing isoforms in wild‐type HCT116 and E10‐GT‐mutant cells. A new splicing isoform was detected in RT‐PCR analysis. D, Analysis of DNA sequences of the new splicing in c by Sanger sequencing. E, Comparison of DNA sequences around the splicing sites neighbouring exons 9 and 10 and the new splicing. The splicing donor sites of ‘GT’ were highlighted in red. F, Western blot analysis of PKM2 and GAPDH expression in wild‐type and E9‐GT‐mutant cells (Mut4 and Mut5 clones). G‐H. Comparison of the mRNA reads of differential splicing isoforms resulted from E9‐GT mutation F, or E10‐GT mutation G, in RNA‐seq analysis

Interference of PKM mRNA splicing in zebrafish. A, Schematic diagram of base editing in zebrafish. pkm gRNA and BE4max mRNA were microinjected into the zygote. The tail was collected for genotyping after culture for 24 h. Adult zebrafishes were subjected to phenotyping, targeted deep sequencing (deep‐seq) and RNA‐seq analysis after culture for 3 months. B, Schematic diagram of BE4max‐induced C‐to‐T in pkm of zebrafish. pkm contains exon 10 and pkm‐x1 contains exon 9. The gRNA sequence targeting AG‐exon 10 is underlined in black and the PAM sequence is underlined in red. The targeted G‐to‐A conversion is highlighted in red. C, Base editing in zebrafish. BE4max mRNA and gRNA targeting GFP (Ctrl) or pkm were co‐injected into zygotes. The number of survival embryos and survival rates were calculated. Moreover, the number of embryos with genotyping results was also provided. D, The chromatogram of Sanger sequencing showing examples of BE4max‐induced C‐to‐T conversions in zebrafish embryos. E, Statistical analysis of the C‐to‐T conversion frequencies induced by BE4max using EidtR in zebrafish embryos. Ctrl, control gRNA group. F, The morphological analysis of control (Ctrl1 and Ctrl2) and mutant (dMut1 and dMut2) zebrafishes. G, The chromatogram of Sanger sequencing for zebrafishes in F. H, RT‐PCR detection of pkm and pkm‐x1 from control (Ctrl1 and Ctrl2) and mutant (dMut1 and dMut2) zebrafishes. PCR fragments were analysed by agarose electrophoresis. I‐K, Targeted deep sequencing analysis of genomic DNA fragments containing the targeting site. The on‐targeting C4‐to‐T conversion rates I, C4‐to‐non‐T conversion rates J, and indel rates were presented in control (Ctrl1 and Ctrl2) and mutant (dMut1 and dMut2) zebrafishes. l. Clustering analysis of mutation zebrafish and normal fish. RNA‐seq analysis of differentially expressed genes in control (Ctrl1 and Ctrl2) and mutant (dMut1 and dMut2) zebrafishes

Model for base editing‐mediated splicing perturbation in functional analysis. Because of the lack of appropriate techniques, the specific functions of the 2 PKM splicing isoforms have not been clarified endogenously yet. In this study, we used CRISPR‐based base editors to perturbate the endogenous alternative splicing of PKM by introducing mutations into the splicing junction sites in HCT116 cells and zebrafish embryos. It is proved that CRISPR‐based base editing strategy can be used to disrupt the endogenous alternative splicing of genes of interest to study the function of specific splicing isoforms in vitro and in vivo

Acknowledgments
This image is the copyrighted work of the attributed author or publisher, and ZFIN has permission only to display this image to its users. Additional permissions should be obtained from the applicable author or publisher of the image. Full text @ Cell Prolif.