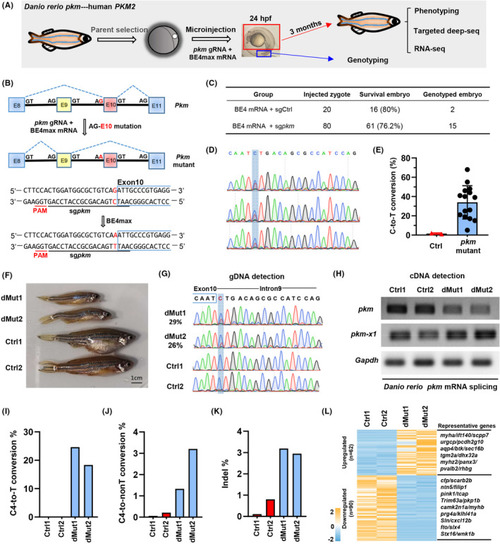
Interference of PKM mRNA splicing in zebrafish. A, Schematic diagram of base editing in zebrafish. pkm gRNA and BE4max mRNA were microinjected into the zygote. The tail was collected for genotyping after culture for 24 h. Adult zebrafishes were subjected to phenotyping, targeted deep sequencing (deep‐seq) and RNA‐seq analysis after culture for 3 months. B, Schematic diagram of BE4max‐induced C‐to‐T in pkm of zebrafish. pkm contains exon 10 and pkm‐x1 contains exon 9. The gRNA sequence targeting AG‐exon 10 is underlined in black and the PAM sequence is underlined in red. The targeted G‐to‐A conversion is highlighted in red. C, Base editing in zebrafish. BE4max mRNA and gRNA targeting GFP (Ctrl) or pkm were co‐injected into zygotes. The number of survival embryos and survival rates were calculated. Moreover, the number of embryos with genotyping results was also provided. D, The chromatogram of Sanger sequencing showing examples of BE4max‐induced C‐to‐T conversions in zebrafish embryos. E, Statistical analysis of the C‐to‐T conversion frequencies induced by BE4max using EidtR in zebrafish embryos. Ctrl, control gRNA group. F, The morphological analysis of control (Ctrl1 and Ctrl2) and mutant (dMut1 and dMut2) zebrafishes. G, The chromatogram of Sanger sequencing for zebrafishes in F. H, RT‐PCR detection of pkm and pkm‐x1 from control (Ctrl1 and Ctrl2) and mutant (dMut1 and dMut2) zebrafishes. PCR fragments were analysed by agarose electrophoresis. I‐K, Targeted deep sequencing analysis of genomic DNA fragments containing the targeting site. The on‐targeting C4‐to‐T conversion rates I, C4‐to‐non‐T conversion rates J, and indel rates were presented in control (Ctrl1 and Ctrl2) and mutant (dMut1 and dMut2) zebrafishes. l. Clustering analysis of mutation zebrafish and normal fish. RNA‐seq analysis of differentially expressed genes in control (Ctrl1 and Ctrl2) and mutant (dMut1 and dMut2) zebrafishes
|

