IMAGE

FIGURE 5

ID
ZDB-IMAGE-210817-30
Source
Figures for Lin et al., 2021
Image
Figure Caption

FIGURE 5

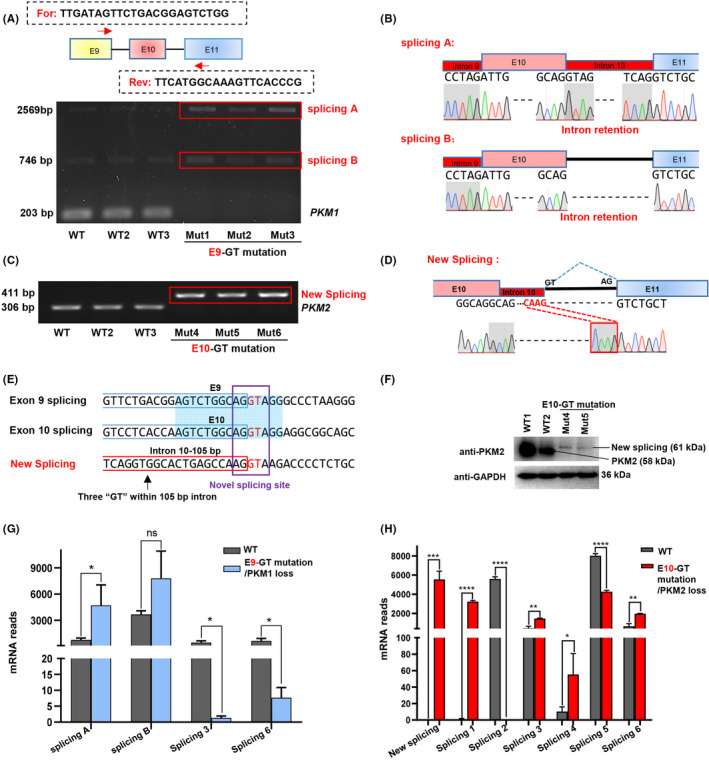
Interference of endogenous PKM splicing generates novel splicing isoforms. A, Detection of splicing isoforms in wild‐type HCT116‐ and E9‐GT‐mutant cells. Two isoforms, defined as splicing A and B, were detected in RT‐PCR analysis. B, Analysis of DNA sequences of splicing A and B by Sanger sequencing. The intron retention was presented as red box. DNA sequences spanning the previous exons and introns were also presented. C, Detection of splicing isoforms in wild‐type HCT116 and E10‐GT‐mutant cells. A new splicing isoform was detected in RT‐PCR analysis. D, Analysis of DNA sequences of the new splicing in c by Sanger sequencing. E, Comparison of DNA sequences around the splicing sites neighbouring exons 9 and 10 and the new splicing. The splicing donor sites of ‘GT’ were highlighted in red. F, Western blot analysis of PKM2 and GAPDH expression in wild‐type and E9‐GT‐mutant cells (Mut4 and Mut5 clones). G‐H. Comparison of the mRNA reads of differential splicing isoforms resulted from E9‐GT mutation F, or E10‐GT mutation G, in RNA‐seq analysis

Acknowledgments
This image is the copyrighted work of the attributed author or publisher, and ZFIN has permission only to display this image to its users. Additional permissions should be obtained from the applicable author or publisher of the image. Full text @ Cell Prolif.