
- Title
-
TFEB Overexpression, Not mTOR Inhibition, Ameliorates RagCS75Y Cardiomyopathy
- Authors
- Kim, M., Lu, L., Dvornikov, A.V., Ma, X., Ding, Y., Zhu, P., Olson, T.M., Lin, X., Xu, X.
- Source
- Full text @ Int. J. Mol. Sci.
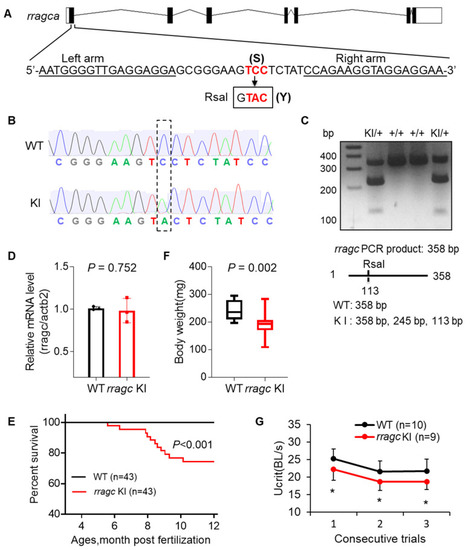
Generation of a zebrafish rragc S56Y knock-in mutant using TALEN. (A) Schematic diagram of rragca gene and the KI mutant. The left and right arm sequences of TALEN are underlined. The target sequence TCC (S) at residue 56 is changed to TAC (Y). Boxed is the newly created RsaI restriction enzyme recognition site. TALEN, transcription activator-like effector nucleases. (B) Shown are chromographs indicating the sequence change from WT to rragc S56Y KI homozygous. WT, wild type; KI, knock-in. (C) A representative genotyping gel to discern KI from WT allele. While WT allele will exhibit a 358 bp band, introduction of a new RsaI restriction site in KI results in a 245 bp and a 113 bp band. (D) RT-qPCR analysis of rragc transcript level in WT and rragc KI (homozygous, same in panel (E–G)) fish hearts. Data were normalized to actb2 and expressed as fold change over WT. (E) Kaplan–Meier survival curves for rragc KI fish and WT siblings by log-rank test. (F) Boxplots (MIN to MAX) illustrates reduced body weight of rragc KI fish at the age of 7 months. n = 10, 19. (G) Swimming capacity of rragc KI mutant compared with the WT siblings in 3 consecutive trials at 7 months. Ucrit, critical swimming speed. BL, body length. Data in (D) and (G) are expressed as mean ± SD, Student’s t test, * p < 0.05 versus WT. |
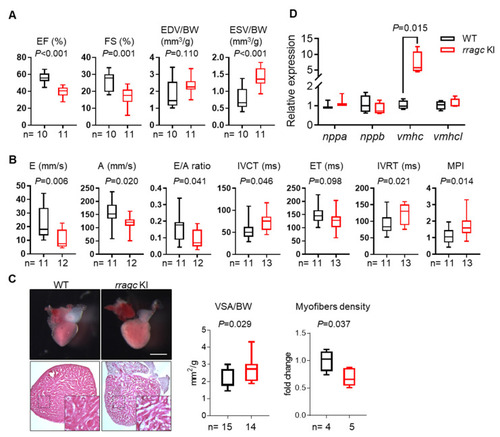
Characterizations of the cardiac phenotype of rragc KI fish at 7 months of age. (A) Echocardiographic measurements for WT (black) and rragc KI (red) fish. EF, ejection function. FS, fractional shortening. EDV, end-diastolic volume. ESV, end-systolic volume. BW, body weight. (B) High-frequency pulsed wave Doppler indices for WT and rragc KI fish at 7 months of age. E, early wave velocity. A, atrial wave velocity. IVCT, isovolumic contraction time. ET, ejection time. IVRT, isovolumic relaxation time. MPI, myocardium performance index, equals (IVCT + IVRT)/ET and was normalized to WT values. (C) Representative images of isolated hearts (upper panel) and H&E staining (lower panel), as well as corresponding quantification of the ventricular surface area (VSA) normalized to BW and trabecular muscle density in WT and rragc KI mutants. Scale bar = 0.5 mm. (D) RT-qPCR analysis of cardiomyopathy molecular markers in WT and rragc KI fish hearts (n = 4, each). Data were normalized to corresponding actb2 levels and rragc KI is expressed as the fold-change versus WT. nppa, natriuretic peptide A; nppb, natriuretic peptide B; vmhc, ventricular myosin heavy chain; vmhcl, ventricular myosin heavy chain-like. Data are shown in boxplot (MIN to MAX) and analyzed by Student’s t test. |
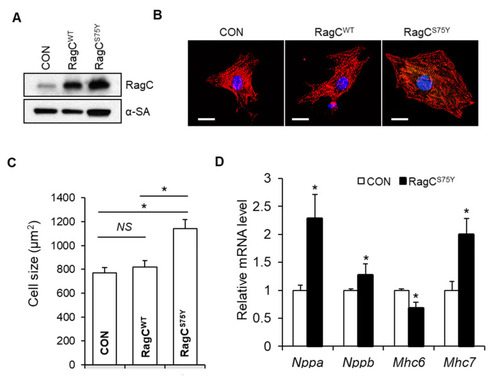
RagCS75Y induces increased myocyte size in NRVCMs. (A) Immunoblots for RagC and alpha-sarcomeric actin (α-SA) in cell lysate of NRVCMs infected with recombinant adenoviruses including Ad:GFP (CON) Ad:RagC wild type (RagCWT), and Ad:RagCS75Y (RagCS75Y). NRVCMs: neonatal rat ventricle cardiomyocytes. (B) Representative confocal images of NRVCMs infected for 48 h. NRVCMs were stained with an anti-alpha actinin antibody (red) and DAPI (blue). Scale bar, 20 μm. (C) Quantification of average cell area of three groups in (B). A total of 150–200 cardiomyocytes per group were measured in each experiment. Data were averaged from 3 independent experiments. * p < 0.05. NS, not significant. (D) Quantification of transcriptional level of hypertrophic molecular markers in NRVCMs. The mRNA values were normalized to 18S rRNA and expressed as fold changes over CON. Nppa, natriuretic peptide A; Nppb, natriuretic peptide B; Mhc6, myosin heavy chain 6; Mhc7, myosin heavy chain 7. n = 3–4. Data are represented as the mean ± SEM, * p < 0.05 versus CON, 2-tailed Student’s t test. |
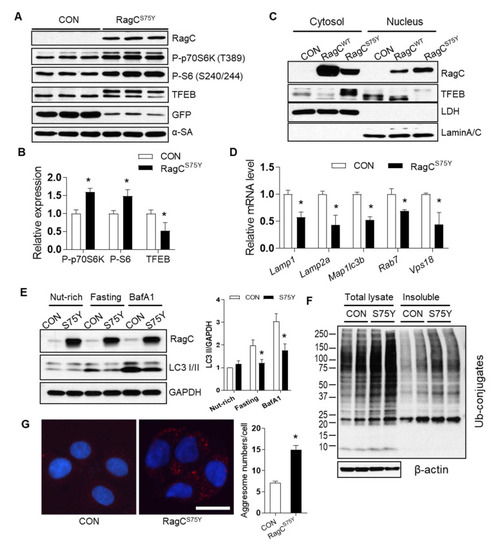
The mTORC1–TFEB-autophagy signaling was dysregulated in RagCS75Y cardiomyocytes. (A) Immunoblot of RagC, P-p70S6K (T389), P-S6 (S240/244), TFEB, GFP, α-SA in cell lysates of NRVCMs infected with Ad:GFP (CON, same as below) and Ad:RagCS75Y (RagCS75Y or S75Y, same as below). (B) Quantification of band intensity normalized by α-SA protein level, n = 3. (C) Representative immunoblot of RagC and TFEB proteins in the nuclear and cytosolic fractions of AD293 cells transfected with GFP and RagCS75Y. LDH and Lamin A/C were used as cytosolic and nuclear protein loading control, respectively. (D) The mRNA level of TFEB target genes in NRVCMs. The mRNA values were normalized to 18S rRNA and expressed as fold change over CON, n = 3–4. Lamp1, lysosomal-associated membrane protein 1; Lamp2a, lysosomal-associated membrane protein 2 alpha; Map1lc3b, microtubule-associated protein 1 light chain 3 beta; Rab7, RAB7, member RAS oncogene family; Vps18, VPS18 core subunit of CORVET and HOPS complexes. (E). Representative immunoblotting images of LC3 II flux in H9C2 cardiomyocytes infected with Ad:GFP (CON) and Ad:RagCS75Y (S75Y) cultured in nutrient rich (nut-rich), HBSS (Fasting, 1 h), and with Bafilomycin A1 (BafA1, 200 nmol/L, 2 h) conditions. (F). Total cell lysate and insoluble protein fractions of CON and S75Y cardiomyocytes were separated by SDS–PAGE and analyzed in immunoblots probed with antibodies against ubiquitin (Ub). β-actin was used as a loading control. (G). Representative image and quantification of aggresomes (red dots) stained by ProteoStat dye in CON and S75Y cardiomyocytes. Bar = 40 um, n > 100 in each group. All quantification data were shown as means ± SD (in C and D) or SEM (in E and G) and analyzed by Student’s t test. * p < 0.05 versus CON. |
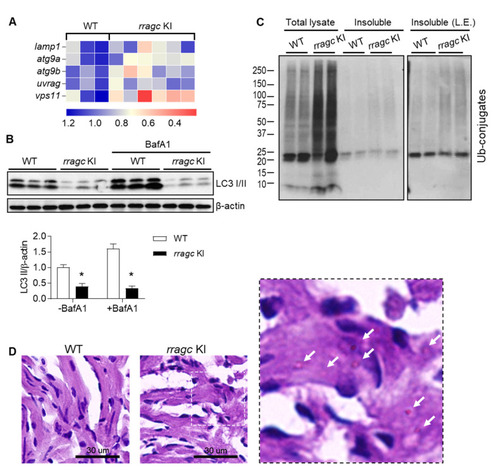
rragc KI fish manifests reduced TFEB activity and defective function of lysosomal clearance. (A) Heatmap of relative mRNA expression levels of genes regulated by TFEB in rragc KI and WT fish hearts. Values are shown as fold change of relative mRNA expression normalized to the mean value of WT. actb2 was used as an internal control. lamp1, lysosomal associated membrane protein 1; atg9a, autophagy related 9A; atg9b, autophagy related 9B; uvrag, UV radiation resistance associated gene; vps11, VPS11 core subunit of CORVET and HOPS complexes. (B) Immunoblot of LC3 in heart lysates of 9-month-old rragc KI and WT fish treated with BafA1 (1.2 ug/g, 6 h) or vehicle via intraperitoneal injection. β-actin as a loading control. * p < 0.05 versus WT. (C) Total lysate and insoluble protein fractions of rragc KI and WT fish heart were separated by SDS–PAGE and immunoblotted against ubiquitin antibodies (Ub). Fish age around 1 year. L.E., longer exposure. (D) Periodic Acid–Schiff (PAS) staining of fish heart tissues. Representative images are shown. Scale bars, 30 μm. The right panel is the higher magnification views of sections indicated by white dash box. Arrows point to glycogen deposit. |
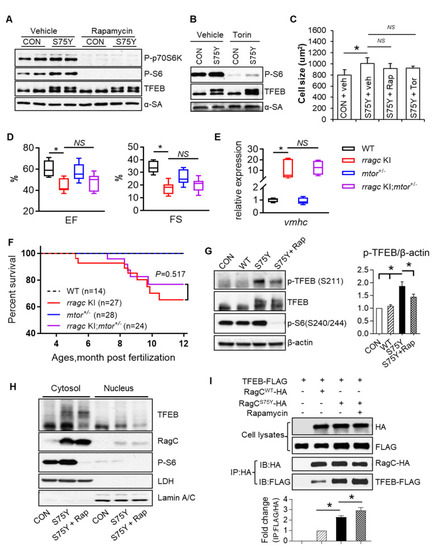
mTORC1 inhibition cannot ameliorate RagCS75Y cardiomyopathy both in vitro and in vivo. (A,B) Immunoblot of P-p70S6K, P-S6, TFEB, and α-SA in NRVCMs. The NRVCMs were infected with Ad:GFP (CON) or Ad:RagCS75Y (S75Y) for 24 h followed by rapamycin (100 nmol/L) or torin (10 nmol/L) or vehicle incubation for another 24 h. (C) Neither rapamycin nor torin rescue the enlarged cell size induced by RagCS75Y. Data were averaged from three independent experiments. * p < 0.05; NS, not significant. Data are mean ± SEM by one-way ANOVA. (D), mtor haploinsufficiency (mtor+/−) did not rescue reduced cardiac function in rragc KI fish. Shown are echocardiographic analysis of EF and FS in the WT control, single mutants, and rragc KI;mtor+/− double mutants at 7 months. n = 8,11,8,10. (E) The abnormal elevated vmhc mRNA expression was not attenuated in rragc KI;mtor+/− double mutant fish at 7 months compared with rragc KI fish. n = 3,5,5,5. Data in (D,E) are shown in boxplot (MIN to MAX). * p < 0.05, NS, not significant versus rragc KI, one-way ANOVA. (F), Kaplan–Meier survival curves of rragc KI;mtor+/− double mutant fish compared with their corresponding single mutants and the WT control by log-rank test. (G). Rapamycin marginally attenuated the increased phosphorylation of TFEB at S211 in S75Y cells. Quantification data was shown as mean ± SEM, * p < 0.05, one-way ANOVA. (H). Rapamycin did not promote TFEB nucleus translocation in S75Y cells. Shown are representative immunoblots of TFEB, RagC, and P-S6 proteins in the nuclear and cytosolic fractions of H9C2 cardiomyocytes infected with Ad:GFP or Ad:RagCS75Y and then treated with 100 nmol/L Rapamycin (S75Y + Rap) or vehicle for 24 h. Lamin A/C and LDH were used as nuclear and cytosolic protein loading control, respectively. (I) AD293 cells were transfected with TFEB–FLAG and RagCWT-HA or RagCS75Y-HA; 24 h later, cells were treated with vehicle or rapamycin (100 nmol/L) or vehicle for another 24 h. Cells were lysed and subjected to immunoprecipitation with the anti-HA antibody. The immunoprecipitates and cell lysates were analyzed by immunoblotting with antibodies against HA (used to detect RagC) and FLAG (used to detect TFEB). IP: immunoprecipitation; IB: immunoblot. Quantification data mean ± SEM, * p < 0.05, one-way ANOVA. |
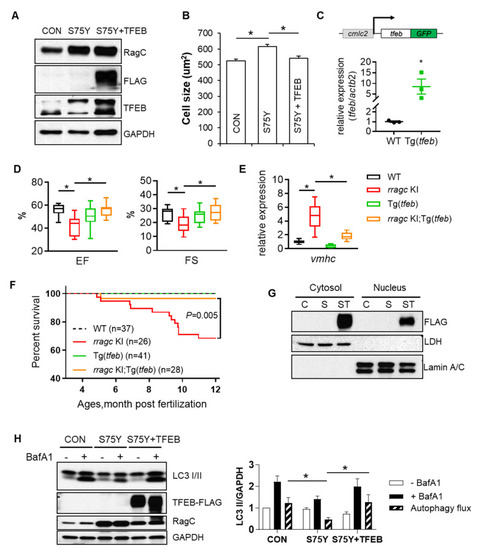
Ectopic expression of TFEB ameliorates RagCS75Y cardiomyopathy both in vitro and in vivo. (A) Immunoblots for RagC, TFEB, and α-SA in cell lysate of NRVCMs infected with recombinant adenoviruses, Ad:GFP (CON), Ad:RagCS75Y (S75Y), Ad:TFEB–FLAG (TFEB) for 48 h. (B) Ectopic TFEB expression normalized cell size in S75Y NRVCMs. NRVCMs were stained for alpha actinin for measurement of cell surface area. A total of 150–200 cardiomyocytes per group were measured in each experiment. Data were averaged from 3 independent experiments. * p < 0.05; NS, not significant. Data are mean ± SEM by one-way ANOVA. (C) Schematic diagram of the cardiac-specific tfeb transgenic fish (upper panel) and their relative tfeb mRNA expression compared to WT fish. * p < 0.05, data are mean ± SEM by student’s t test. (D) Cardiac-specific TFEB overexpression by a transgenic line (Tg(tfeb)) rescued cardiac function in rragc KI fish. Shown are echocardiographic analysis of EF and FS in rragc KI;Tg(tfeb) double mutant fish at 7 months compared with their corresponding single mutants and the WT control. n = 10,12,10,13. (E) Ectopic TFEB expression rescued cardiomyopathy molecular marker expression in vivo. Shown are relative mRNA expression of vmhc normalized to actb2 by RT-qPCR in rragc KI;Tg(tfeb) double mutant fish at 7 months compared with their corresponding single mutants and the WT control. n = 3,6,3,6. Data in (D) and (E) are shown in boxplot (MIN to MAX). * p < 0.05, NS, not significant versus rragc KI, one-way ANOVA. (F) Ectopic TFEB expression improved survival. Shown are Kaplan–Meier survival curves of rragc KI;Tg(tfeb) double mutant fish compared with their corresponding single mutants and the WT control during 1 year observation by log-rank test. (G) Overexpressed TFEB–FLAG is able to translocate into nuclei. Shown are immunoblots of FLAG indicating exogenous TFEB proteins in the nuclear and cytosolic fractions of CON (C), S75Y (S) and S75Y + TFEB (ST) H9C2 cardiomyocytes. Lamin A/C and LDH were used as nuclear and cytosolic protein loading control, respectively. (H) Ectopic TFEB expression was sufficient to restore dysregulated autophagy flux in S75Y cells. Shown are representative immunoblotting images in CON, S75Y, and S75Y + TFEB cardiomyocytes treated with BafA1 (200 nM, 2 h) or vehicle. LC3 II band intensity normalized by GAPDH were quantified in the graph. Autophagy flux were calculated as “black column value”−“white column value”, n = 4. * p < 0.05, data are mean ± SEM by one-way ANOVA. PHENOTYPE:
|

Schematic mechanism of RagCS75Y cardiomyopathy and a candidate therapeutic strategy. (Left) Under full nutrients condition, the wild type heterodimeric Rags (formed by either RagA or RagB and RagC and RagD) is in the inactive state, leading to mTORC1 detachment from the lysosome and to its inactivation. TFEB is dephosphorylated and able to translocate to the nucleus, where it activates gene expression programs that boost lysosomal function and autophagy. (Right) The S75Y mutation drives Rags to be active, which recruits mTORC1 and TFEB to the lysosome surface, where phosphorylation of TFEB by active mTORC1 happens. The TFEB cycles between cytoplasm and the lysosomal surface limits its nucleus translocation, which triggers cascades of pathological changes, such as dysregulated autophagy, which ultimately result in cardiomyopathy. Exogenous expression of TFEB is an effective therapeutic strategy that restores nucleus translocation of TFEB and ameliorates RagCS75Y cardiomyopathy. |