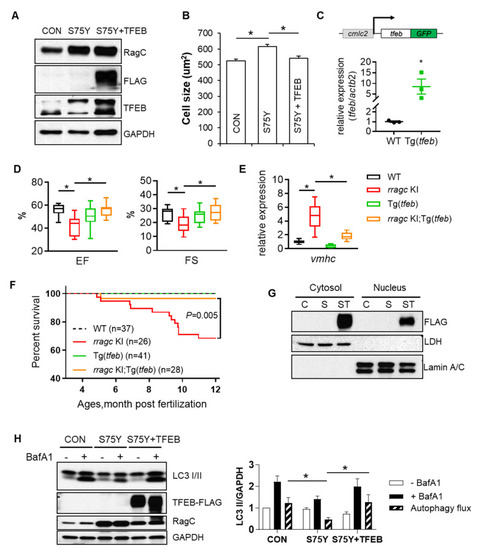
Ectopic expression of TFEB ameliorates RagCS75Y cardiomyopathy both in vitro and in vivo. (A) Immunoblots for RagC, TFEB, and α-SA in cell lysate of NRVCMs infected with recombinant adenoviruses, Ad:GFP (CON), Ad:RagCS75Y (S75Y), Ad:TFEB–FLAG (TFEB) for 48 h. (B) Ectopic TFEB expression normalized cell size in S75Y NRVCMs. NRVCMs were stained for alpha actinin for measurement of cell surface area. A total of 150–200 cardiomyocytes per group were measured in each experiment. Data were averaged from 3 independent experiments. * p < 0.05; NS, not significant. Data are mean ± SEM by one-way ANOVA. (C) Schematic diagram of the cardiac-specific tfeb transgenic fish (upper panel) and their relative tfeb mRNA expression compared to WT fish. * p < 0.05, data are mean ± SEM by student’s t test. (D) Cardiac-specific TFEB overexpression by a transgenic line (Tg(tfeb)) rescued cardiac function in rragc KI fish. Shown are echocardiographic analysis of EF and FS in rragc KI;Tg(tfeb) double mutant fish at 7 months compared with their corresponding single mutants and the WT control. n = 10,12,10,13. (E) Ectopic TFEB expression rescued cardiomyopathy molecular marker expression in vivo. Shown are relative mRNA expression of vmhc normalized to actb2 by RT-qPCR in rragc KI;Tg(tfeb) double mutant fish at 7 months compared with their corresponding single mutants and the WT control. n = 3,6,3,6. Data in (D) and (E) are shown in boxplot (MIN to MAX). * p < 0.05, NS, not significant versus rragc KI, one-way ANOVA. (F) Ectopic TFEB expression improved survival. Shown are Kaplan–Meier survival curves of rragc KI;Tg(tfeb) double mutant fish compared with their corresponding single mutants and the WT control during 1 year observation by log-rank test. (G) Overexpressed TFEB–FLAG is able to translocate into nuclei. Shown are immunoblots of FLAG indicating exogenous TFEB proteins in the nuclear and cytosolic fractions of CON (C), S75Y (S) and S75Y + TFEB (ST) H9C2 cardiomyocytes. Lamin A/C and LDH were used as nuclear and cytosolic protein loading control, respectively. (H) Ectopic TFEB expression was sufficient to restore dysregulated autophagy flux in S75Y cells. Shown are representative immunoblotting images in CON, S75Y, and S75Y + TFEB cardiomyocytes treated with BafA1 (200 nM, 2 h) or vehicle. LC3 II band intensity normalized by GAPDH were quantified in the graph. Autophagy flux were calculated as “black column value”−“white column value”, n = 4. * p < 0.05, data are mean ± SEM by one-way ANOVA.
|
