
- Title
-
The aspartyl protease DDI2 activates Nrf1 to compensate for proteasome dysfunction
- Authors
- Koizumi, S., Irie, T., Hirayama, S., Sakurai, Y., Yashiroda, H., Naguro, I., Ichijo, H., Hamazaki, J., Murata, S.
- Source
- Full text @ Elife
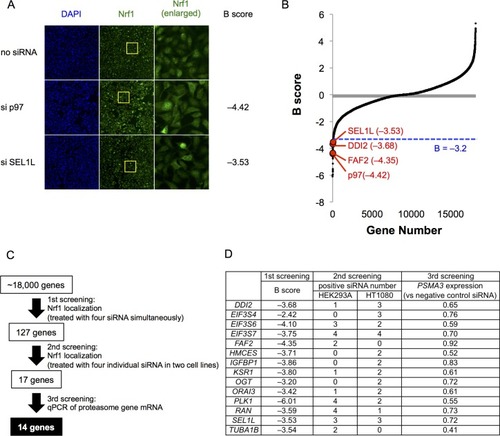
(A) Representative images of Nrf1 localization in control cells (no siRNA) and cells transfected with siRNA targeting p97 or SEL1L in the primary screen. Yellow-boxed regions are magnified and displayed in the right panels. (B) B score of all samples in the primary screen. Data are ordered from lowest to highest. Dashed blue line represents a cutoff value for positive hits. Some of the representative final hits are shown as red dots. The list of B scores for all samples in the primary screen are available in the Figure 1—source data 1. (C) Workflow and summary of the genome-wide siRNA screen. (D) List of the 14 final hit genes and the score in each assay throughout the screening process. |
( |

(A) Representative images of Nrf1 localization. HEK293A cells were transfected with a non-targeting control (negative control), DDI2, or p97 siRNA and then treated with 50 nM bortezomib for 14 hr before fixation. (B) Immunoblotting of whole-cell lysates of cells in (A) treated with or without bortezomib. Nrf1 is detected as three different forms; a glycosylated form (G), full-length form (FL), and processed form (P). (C) Immunoblotting of Nrf1 after deglycosylation treatment. HEK293A cells were transfected with DDI2 or p97 siRNA, followed by transfection with Nrf1-3×Flag, and then treated with or without 50 nM bortezomib. The cell lysates were treated with or without Endo H. DeG denotes deglycosylated Nrf1 |
( |
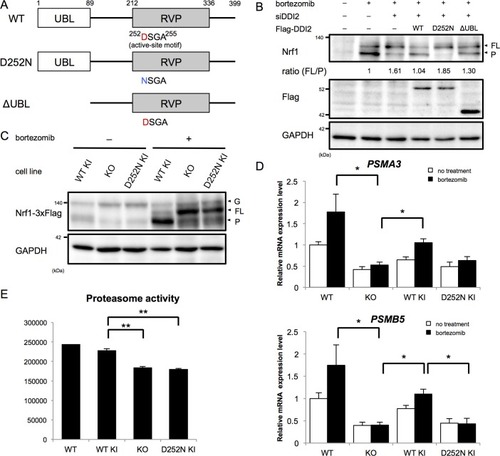
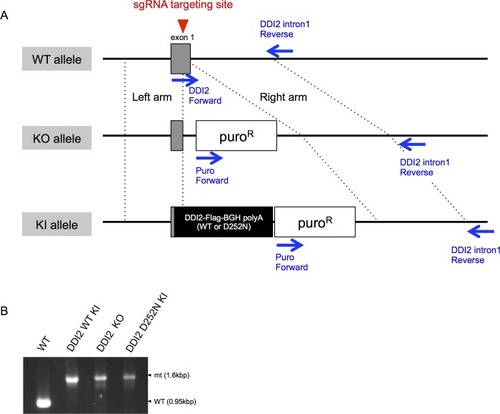
(A) Schematic diagram of wild-type (WT) and each mutant of DDI2. Ubiquitin-like (UBL) domain and retroviral protease-like (RVP) domain are represented as filled rectangles. The putative aspartyl protease active site amino acid sequence is shown. (B) HEK293A cells were transfected with DDI2 siRNA and after 24 hr were transfected with a plasmid encoding WT or mutant DDI2 shown in (A), followed by 50 nM bortezomib treatment for 14 hr before harvest. The signal intensity ratio of Nrf1 full-length form (FL) to the processed form (P) was calculated, where the ratio for bortezomib treatment alone was set as 1. (C) Immunoblotting of whole cell lysates of DDI2 WT knock-in (KI), DDI2 knockout (KO), and DDI2 D252N KI HCT116 cells. The cells transfected with Nrf1-3×Flag were treated with or without 50 nM borteaomib. (D) Relative mRNA expression of the proteasome genes PSMA3 and PSMB5 in WT, DDI2 KO, DDI2 WT KI, and DDI2 D252N KI HCT116 cells. mRNA levels of target genes were normalized by GUSB mRNA levels. The data represent mean + standard error of the mean (SEM) (n = 3, biological replicates). Statistical comparison was made by Tukey’s test (*p<0.05). (E) Proteasome peptidase activity of cell lysates of the indicated cell lines. The data represent mean + SEM (n = 3, biological replicates). Statistical comparison was made by Tukey’s test (**p<0.01). |
( |