
|
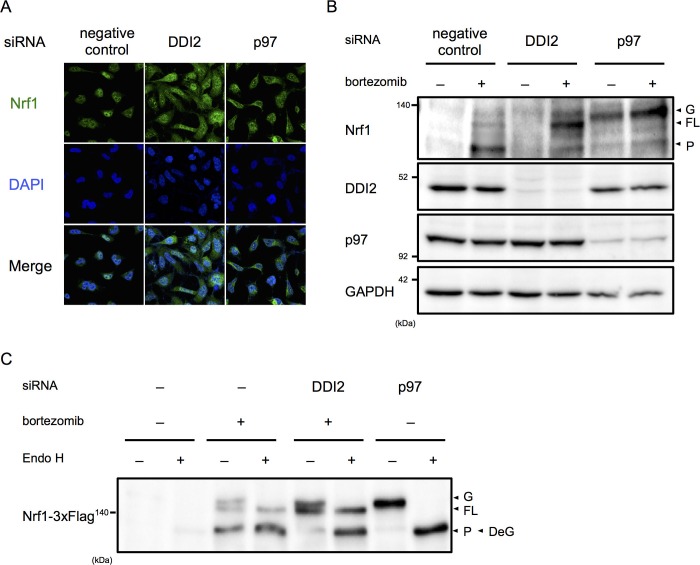
Figure 2 (A) Representative images of Nrf1 localization. HEK293A cells were transfected with a non-targeting control (negative control), DDI2, or p97 siRNA and then treated with 50 nM bortezomib for 14 hr before fixation. (B) Immunoblotting of whole-cell lysates of cells in (A) treated with or without bortezomib. Nrf1 is detected as three different forms; a glycosylated form (G), full-length form (FL), and processed form (P). (C) Immunoblotting of Nrf1 after deglycosylation treatment. HEK293A cells were transfected with DDI2 or p97 siRNA, followed by transfection with Nrf1-3×Flag, and then treated with or without 50 nM bortezomib. The cell lysates were treated with or without Endo H. DeG denotes deglycosylated Nrf1