
- Title
-
Chemical-induced craniofacial anomalies caused by disruption of neural crest cell development in a zebrafish model
- Authors
- Liu, S., Narumi, R., Ikeda, N., Morita, O., Tasaki, J.
- Source
- Full text @ Dev. Dyn.
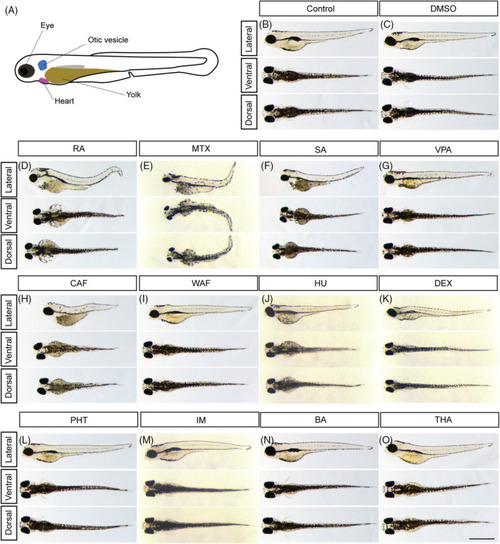
Gross morphological anomalies of teratogen‐treated zebrafish embryos at 96 hpf. A, Schematic diagram of zebrafish embryo at 96 hpf. B, E3 control. C, DMSO control. D, RA, retinoic acid. E, MTX, methotrexate. F, SA, salicylic acid. G, VPA, valproic acid. H, CAF, caffeine. I, WAF, warfarin. J, HU, hydroxyurea. K, DEX, dexamethasone. L, PHT, phenytoin. M, IM, imatinib. N, BA, boric acid. O, THA, thalidomide. Scale bar: 1 mm |

Alcian blue‐stained zebrafish embryos at 96 hpf displayed abnormal cranial development. A, Craniofacial atlas of the lateral view, the viscerocranium (ventral view) and the neurocranium (dorsal view): Bh, Basihyal; Cb, Ceratobranchial; Ch, Ceratohyal; Hm, Hyomandibula; Hs, Hyosymplectic; Ih, Interhyal; M, Meckel's; OP, Opercle (bone); Pq, Palatoquadrate; Ep, Ethmoid plate; Tr, Trabeculae; Pch, Parachordal of craniofacial structures. B‐O, Zebrafish treated with the following teratogens showed cranial malformations: B, Control, E3; C, DMSO, vehicle control; D, RA, retinoic acid; E, MTX, methotrexate; F, SA, salicylic acid; G, VPA, valproic acid; H, CAF, caffeine; I, WAF, warfarin; J, HU, hydroxyurea; K, DEX, dexamethasone; L, PHT, phenytoin; M, IM, imatinib; N, BA, boric acid; O, THA, thalidomide. P, The summary of craniofacial anomalies (Control: n = 45, DMSO: n = 40, RA: n = 35, MTX: n = 31, SA: n = 27, VPA: n = 36, CAF: n = 34, WAF: n = 32, HU: n = 28, DEX: n = 36, PHT: n = 35, IM: n = 27, BA: n = 33, THA: n = 39). Q, The body length analysis. Scale bars: 200 μm |
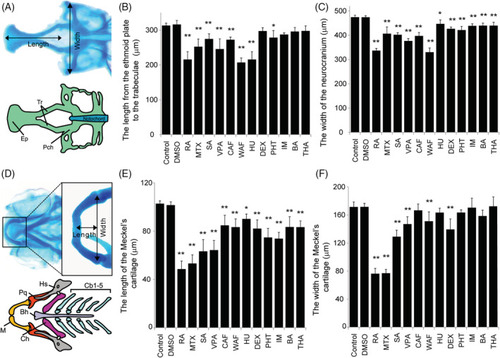
Quantitative measurement of craniofacial malformations. A, The definitions of the length and width in neurocranium measurements. B and C, The length and width of the neurocranium were quantified. D, The definition of the length and width of the Meckel's cartilage in viscerocranium measurement. E and F, The length and width of the Meckel's cartilage were quantified. The one‐way ANOVA followed by Dunnett's multiple comparison tests was used to compare the values between the control and the chemical‐treated group (* |
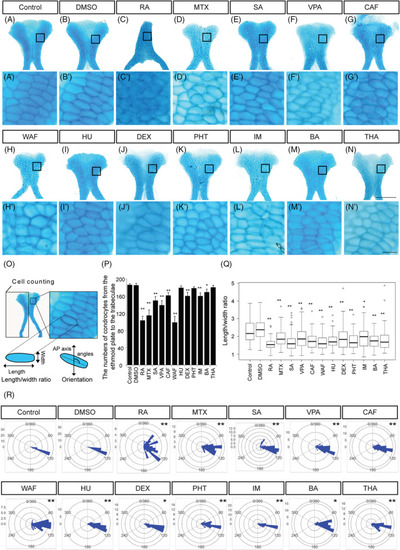
The number of chondrocytes and their shape in ethmoid plate were affected by teratogen treatment. A–N, The ethmoid plate was dissected from Alcian blue‐stained samples and was flat‐mounted. Anterior is to the top. A′–N′, Magnified view of chondrocytes in the ethmoid plate in the region indicated by the boxed area in A–N. O, The region in which cell counts were determined in the ethmoid plate and the definitions of the length and width of the chondrocytes used for the cell shape analysis. The orientation of longest cell axis was measured to quantify chondrocyte stacking. P, The number of chondrocytes in half of the ethmoid plate was counted (n = 5). Q, The length/width ratio of the chondrocytes in Figure |
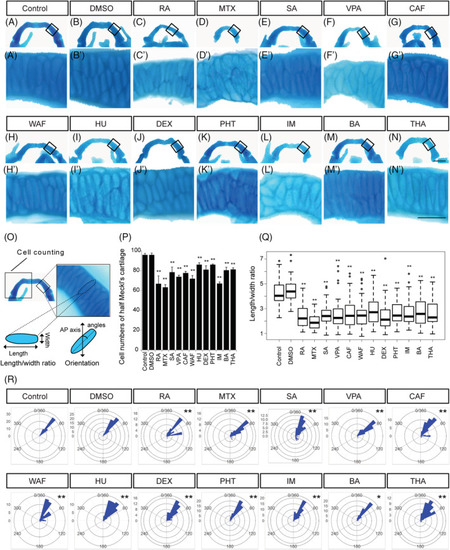
The number of chondrocytes and their shape in the Meckel's cartilage were affected by teratogen treatment. A–N, The Meckel's cartilage was dissected from Alcian blue‐stained samples and was flat‐mounted. Anterior is to the top. A′–N′, Magnified view of chondrocytes in the Meckel's cartilage indicated by the boxed area in A–N. Anterior is to the top. O, The area used for cell counting in the Meckel's cartilage and the definition of the length and width of the chondrocytes used for the cell shape analysis. The orientation of the longest cell axis was measured to quantify chondrocyte stacking. P, The number of chondrocytes in half of the Meckel's cartilage was measured (n = 5). Q, The length/width ratio of the chondrocytes in A′–N′, was measured (at least 60 cells were measured per group, n = 3). R, The chondrocyte orientation was indicated by rose plot (at least 60 cells were measured per group, n = 3). Orientation was significantly different from those of control and vehicle control (Watson's U2 test; * |
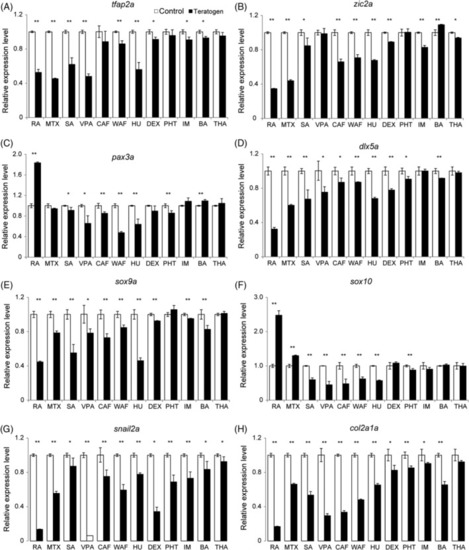
The expression levels of neural crest cell‐related genes were perturbed in teratogen‐treated embryos. Relative expression levels were examined by RT‐qPCR at 48 hpf. The examined genes were as follows: |
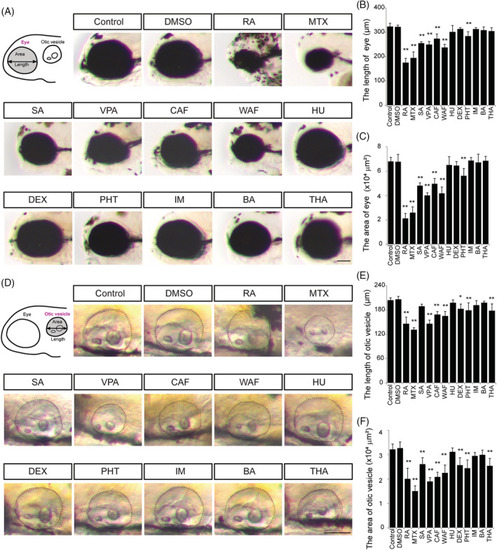
Defects in eye and otic vesicle were observed in teratogen‐treated embryos. A, Schematic image and bright field images of the eye. Anterior is to the left. B and C, Quantification of the length and area of the eye. D, Schematic image and bright field images of the otic vesicle. E and F, Quantification of the length and area of the otic vesicle. Asterisks indicate statistically significant differences between groups (* |
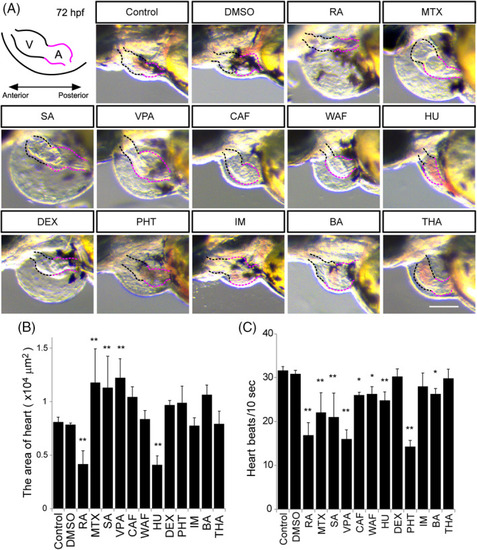
Morphological defects of the heart and measurement of the heart beat rate. A, Illustration of the embryonic heart at 72 hpf. V stands for the ventricle marked by the black‐dotted line. A stands for the atrium marked by the red‐dotted line. B, The maximum ventricle ventricular and maximum atrium diastole were measured. C, Heart beat rate was calculated in a 10‐second window based on supplemental |
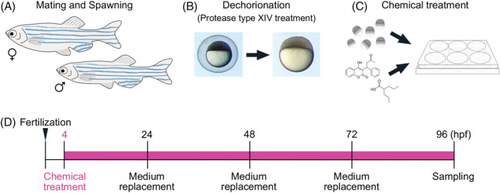
Chemical exposure procedure. A, Adult male and female zebrafish were placed together in a breeding tank equipped with a partition plate and a mesh tray for collecting fertilized eggs the day before spawning. B, Before chemical exposure, fertilized eggs were treated with protease type XIV for dechorionation. C, The dechorionated eggs were placed in a 6‐well plate and treated with a teratogen. D, Time course of chemical treatment. Chemical treatment started at 4 hpf and exposure medium was replaced daily. The samples were collected at 96 hpf and were processed for further analysis |