
IMAGE
FIGURE 6
- ID
- ZDB-IMAGE-200730-29
- Publication
- Liu et al., 2020 - Chemical-induced craniofacial anomalies caused by disruption of neural crest cell development in a zebrafish model
- All Figures
- Figures for Liu et al., 2020
Image
|
Figure Caption
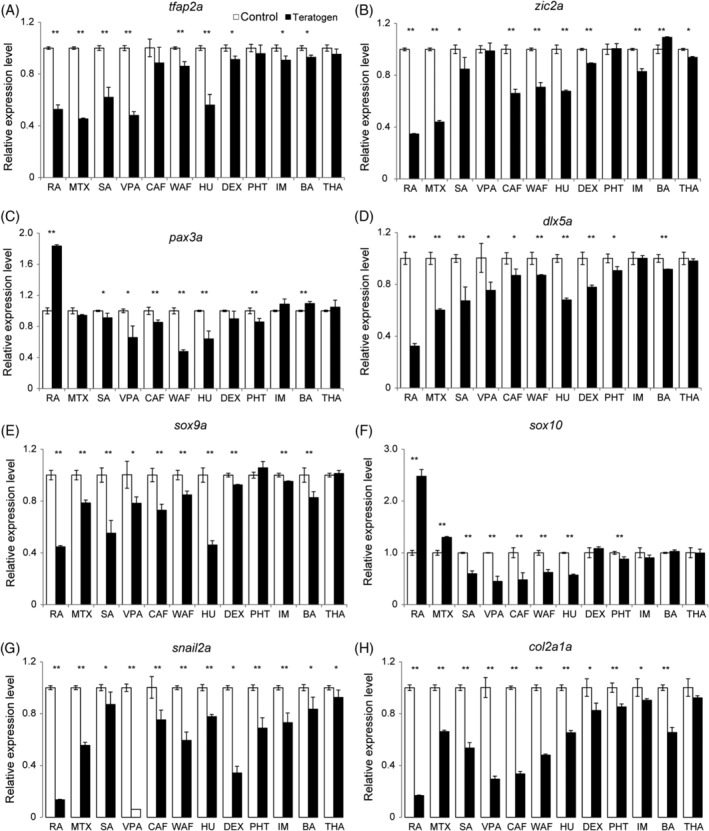
FIGURE 6
The expression levels of neural crest cell‐related genes were perturbed in teratogen‐treated embryos. Relative expression levels were examined by RT‐qPCR at 48 hpf. The examined genes were as follows:
Acknowledgments
This image is the copyrighted work of the attributed author or publisher, and
ZFIN has permission only to display this image to its users.
Additional permissions should be obtained from the applicable author or publisher of the image.
Full text @ Dev. Dyn.