
FIGURE 4
- ID
- ZDB-FIG-200730-27
- Publication
- Liu et al., 2020 - Chemical-induced craniofacial anomalies caused by disruption of neural crest cell development in a zebrafish model
- Other Figures
- All Figure Page
- Back to All Figure Page
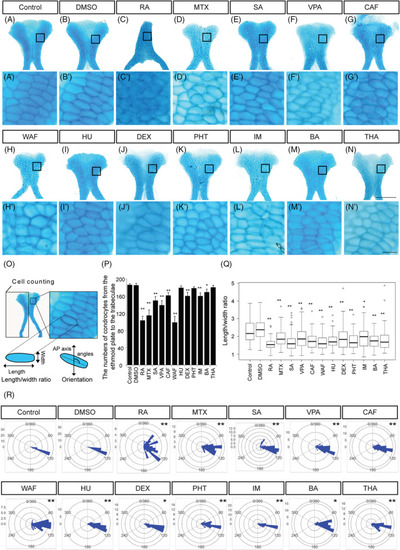
The number of chondrocytes and their shape in ethmoid plate were affected by teratogen treatment. A–N, The ethmoid plate was dissected from Alcian blue‐stained samples and was flat‐mounted. Anterior is to the top. A′–N′, Magnified view of chondrocytes in the ethmoid plate in the region indicated by the boxed area in A–N. O, The region in which cell counts were determined in the ethmoid plate and the definitions of the length and width of the chondrocytes used for the cell shape analysis. The orientation of longest cell axis was measured to quantify chondrocyte stacking. P, The number of chondrocytes in half of the ethmoid plate was counted (n = 5). Q, The length/width ratio of the chondrocytes in Figure |