
FIGURE 5
- ID
- ZDB-IMAGE-200730-28
- Publication
- Liu et al., 2020 - Chemical-induced craniofacial anomalies caused by disruption of neural crest cell development in a zebrafish model
- All Figures
- Figures for Liu et al., 2020
|
FIGURE 5
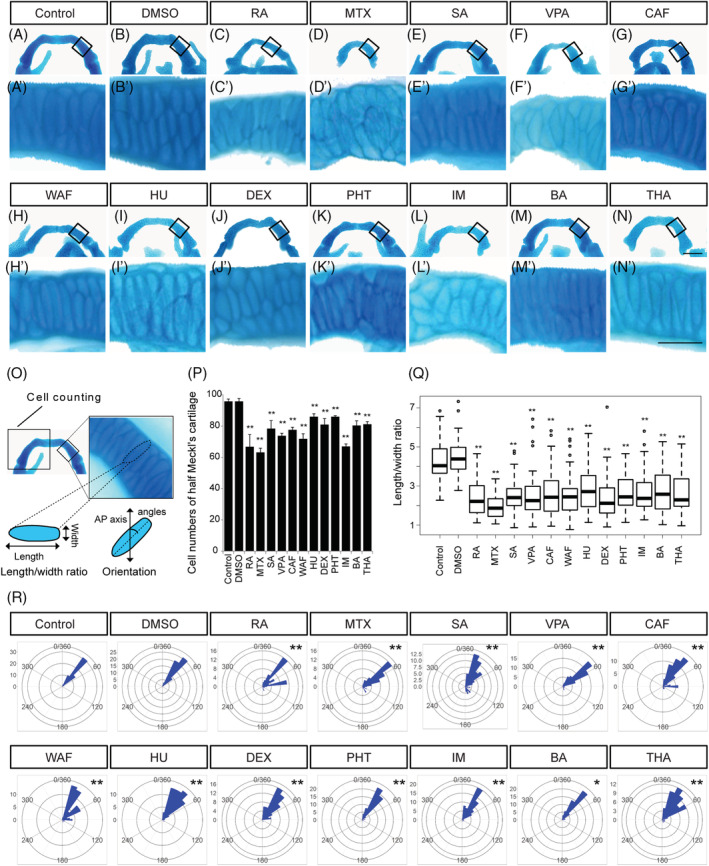
The number of chondrocytes and their shape in the Meckel's cartilage were affected by teratogen treatment. A–N, The Meckel's cartilage was dissected from Alcian blue‐stained samples and was flat‐mounted. Anterior is to the top. A′–N′, Magnified view of chondrocytes in the Meckel's cartilage indicated by the boxed area in A–N. Anterior is to the top. O, The area used for cell counting in the Meckel's cartilage and the definition of the length and width of the chondrocytes used for the cell shape analysis. The orientation of the longest cell axis was measured to quantify chondrocyte stacking. P, The number of chondrocytes in half of the Meckel's cartilage was measured (n = 5). Q, The length/width ratio of the chondrocytes in A′–N′, was measured (at least 60 cells were measured per group, n = 3). R, The chondrocyte orientation was indicated by rose plot (at least 60 cells were measured per group, n = 3). Orientation was significantly different from those of control and vehicle control (Watson's U2 test; *