
IMAGE
FIGURE 7
- ID
- ZDB-IMAGE-200730-30
- Publication
- Liu et al., 2020 - Chemical-induced craniofacial anomalies caused by disruption of neural crest cell development in a zebrafish model
- All Figures
- Figures for Liu et al., 2020
Image
|
Figure Caption
FIGURE 7
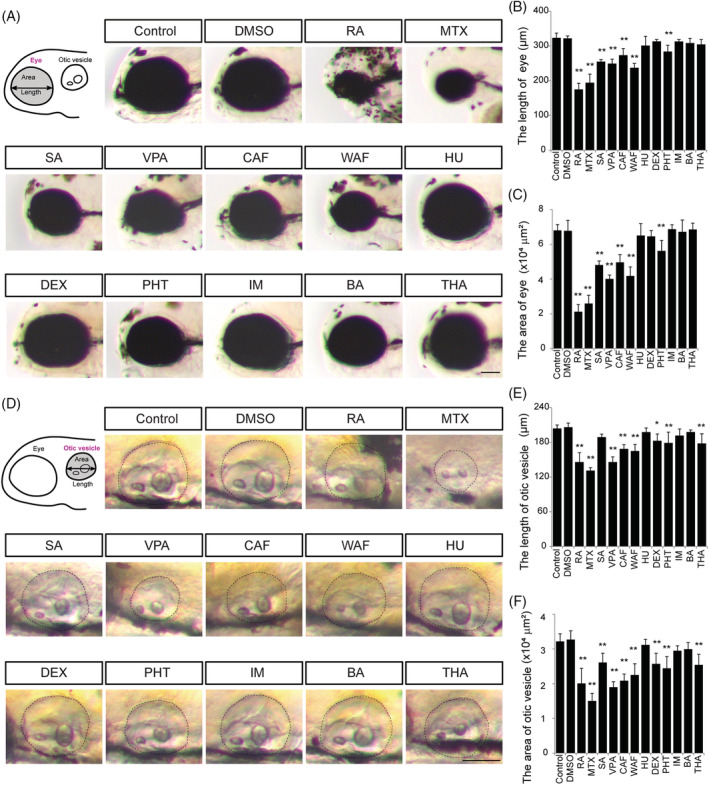
Defects in eye and otic vesicle were observed in teratogen‐treated embryos. A, Schematic image and bright field images of the eye. Anterior is to the left. B and C, Quantification of the length and area of the eye. D, Schematic image and bright field images of the otic vesicle. E and F, Quantification of the length and area of the otic vesicle. Asterisks indicate statistically significant differences between groups (*
Acknowledgments
This image is the copyrighted work of the attributed author or publisher, and
ZFIN has permission only to display this image to its users.
Additional permissions should be obtained from the applicable author or publisher of the image.
Full text @ Dev. Dyn.