FIGURE SUMMARY
Title

Expression of tert Prevents ALT in Zebrafish Brain Tumors

Authors
Idilli, A.I., Cusanelli, E., Pagani, F., Berardinelli, F., Bernabé, M., Cayuela, M.L., Poliani, P.L., Mione, M.C.
Source
Full text @ Front Cell Dev Biol

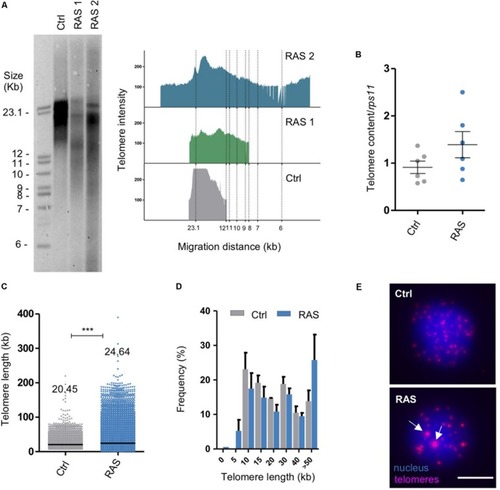
Zebrafish brain tumors have heterogeneous telomeres. (A) Telomere length analysis via TRF in one control and two RAS tumors. The panel on the right shows TFR analysis obtained by graphing intensity of the signal versus DNA migration. (B) Relative telomere content determined by telomere qPCR and normalized to the signal of a single copy gene (rps11) in controls (Ctrl, n = 7 brains) and RAS tumors (RAS, n = 7 brains). Bars represent mean ± SEM. (C) Quantification of relative telomere length measured by Q-FISH and given a kb value based on the fluorescent intensity of L5178Y-S and L5178Y-R lymphocyte cells with known telomere lengths of 10.2 and 79.7 kb, respectively. See also Supplementary Figure 1B. Number of telomeres examined: Ctrl n = 3027, RAS = 9738. Data from three independent experiments were combined. Median values are reported on the graph. ***p < 0.0001. Scatterplot bars represent median. (D) Distribution of telomere length evaluated by Q-FISH in Control (gray n = 2) and RAS tumors (light blue n = 3). The very long telomeres (>30 kb) could represent telomeric clusters, an ALT feature. (E) Representative fluorescent microscope images of Q-FISH analysis of control and RAS nuclei with ultrabright foci (white arrows). Scale bar: 5 μm. TRF: telomere restriction fragment; Ctrl: control; RAS: brain tumors. See also Supplementary Figure 1.

Telomerase is not involved in telomere maintenance in zebrafish brain tumors. (A) Relative telomerase activity measured by Q-TRAP in control, RAS and tert-/- brains, using 1 μg of protein extracts. RNase treatment (+) was used as a negative control to confirm the specificity of the assay, n = 6; **p = 0.005. (B) Expression of zebrafish tert and terc mRNA in brain tumors measured by RT-qPCR. Values were normalized to rps11 mRNA levels and are relative to tert and terc expression in control brains (gray line set at 1.0) n = 6; *p < 0.05. (C) Schematic representation of the genomic region harboring putative CpG island on the tert promoter, according to Ensemble (upper panel) and EMBOSS CpG plot (lower panel) databases. Position of primers used in ChIP experiments is shown as arrows. Red arrows show primers amplifying a putative CpG island. (D) qPCR analysis of DNA CpG Methylation (5-methylcytosine) status of the tert promoter in control and brain tumors of 2 month old fishes. Different regions of the promoter were analyzed, red arrows indicate the position and primers for a putative CpG island. Values were normalized first to rps11 and then to 5mC enrichment, with IgG enrichment set at 1.0. Bars in a, b, e represent mean ± SEM. n = 4–6. Ctrl: control brain, RAS: brain tumor.

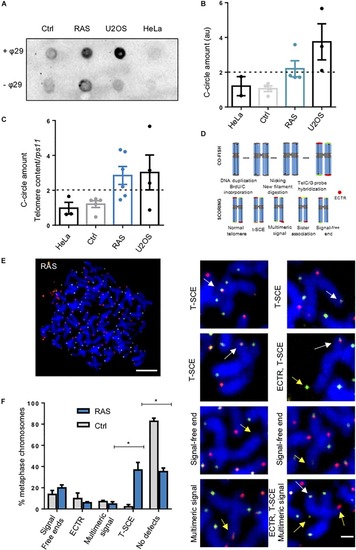
Zebrafish brain tumors are ALT. (A) Representative C-Circle assay by dot blot in one control and one brain tumor compared with telomerase positive HeLa cells and ALT U2OS cells. Reactions without phy29 polymerase (–θ29) were included as a control. (B) Quantitation and analysis of 4 C-Circle assay dot blot. Determination of ALT amount was calculated after subtracting global background and specific –θ29 signal. a.u.: arbitrary unit. (C) C-Circle assay quantified by telomere qPCR. Data are represented as amount of C-circles, normalized to telomere content (TC) and single copy gene (rps11). HeLa and U2OS were added as a reference. Ctrl n = 5; RAS n = 7. The dashed line indicates the level above which ALT activity is considered significant. Whiskers box plots represent median: min to max values. (D) Schematic drawing to describe the procedure for 2-color CO-FISH and the interpretation of telomere status based on the signals. (E) Two-color CO-FISH of a representative metaphase nucleus derived from a RAS brain tumor cell (scale bar 5 μm). The right panels (D) show details of telomeres with T-SCE (white arrows), signal free ends, multimeric signal and/or ECTR (yellow arrows) (scale bar 1 μm). (F) Quantitation of telomeric defects revealed in RAS brain (n = 88 chromosomes) compared with Control brain (n = 56 chromosomes). T-SCE: Telomere Sister Chromatid Exchange; ECTR: Extra-Chromosomal Telomeric Repeat; CO-FISH: Chromosome orientation FISH. Multiple t-test, Holm Sidak methods, *p < 0.05. Bars represent mean ± SEM. See also Supplementary Figure 2.

Zebrafish brain tumors exhibit elevated TERRA expression. (A) Schematic drawing describing the generation of TERRA from subtelomeric regions. Cen = centromere, RNA pol II = RNA polymerase II. (B) Representative pictures of TERRA RNA-FISH in cell nuclei (blue) from control (ctrl), tumor (RAS) and RNase treated tumor cells (+RNAse). TERRA foci are shown in magenta. Scale bar: 5 μm. (C) Scatter plot of TERRA RNA-FISH expression measured as the number of foci per nucleus in Control (Ctrl, n = 55) and tumor (RAS, n = 51) nuclei. Representative data from one of three experiments are shown (**p = 0.013). Bars represent mean ± SEM. (D) Scatter plot of TERRA RNA-FISH signals measured as fluorescent intensity per spot per nucleus in control (Ctrl) and RAS brains. Representative data from one of three experiments are shown (***p < 0.001). Bars represent mean ± SEM. (E) TERRA expression measured by dot blot from total RNA (500 ng) of a control and a RAS brain tumor (upper panel); to control for RNA loading, hybridization with an actin RNA probe was performed (lower panel). (F) qPCR analysis of TERRA expression in brain tumors and controls. Values were normalized first to rps11 mRNA levels and then related to TERRA expression in control brains (n = 3). TERRA expression levels were also evaluated in HeLa and U2OS cells (n = 2 samples each) for comparison. Reactions without reverse transcriptase were performed as controls for TERRA quantification (-RT, ND: not detectable). Control bars represent mean ± SEM.

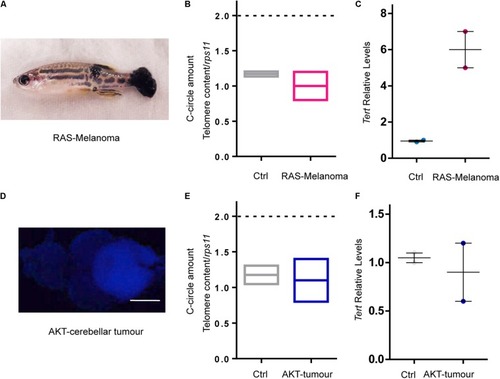
RAS expression is not the main driver of ALT in zebrafish cancer. (A) Image of a fish with melanoma induced by overexpression of oncogenic RAS. (B) C-Circle quantification by telomeric qPCR in control skin and melanoma (n = 2). (C) Measurement of tert expression in control skin and melanoma. Values were normalized first to rps11 mRNA and then to tert expression in control skin (n = 2). (D) Image of a zebrafish brain with an AKT – driven cerebellar tumor. Calibration bar: 0.5 mm. (E) C-Circle quantification by telomeric Q-PCR in control brain and AKT – driven cerebellar tumors (n = 2). (F) Measurement of tert expression in control brains and AKT – driven cerebellar tumors. Values were normalized first to rps11 and then to tert expression in control brains (n = 2). Bars represent mean ± SEM.

EXPRESSION / LABELING:
Gene:
Fish:
Anatomical Term:
Stage Range: Protruding-mouth to Days 21-29
PHENOTYPE:
Fish:
Observed In:
Stage Range: Protruding-mouth to Adult

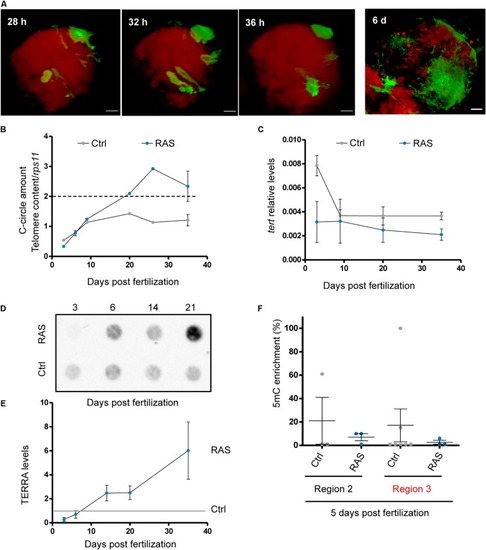
Development of ALT is preceded by a reduction of tert expression. (A) Representative images of tumor development from single cancer initiating clones to tumoral masses. h: hours; d: days. (B) C-Circle assay measured by telomeric qPCR during tumor development in control and RAS brains. Data are represented as CCA amount normalized to telomere content (TC) and single copy gene (rps11). The dashed line indicates the level above which ALT activity is considered significant Bars represent mean ± SEM. (C) RT-qPCR analysis of tert expression during tumor development. The data were normalized first to rps11 mRNA levels and are expressed as 2 (–ΔCt). Bars represent mean ± SEM. The experiment was replicated almost three times for each time points. (D) Representative dot blot of TERRA levels during tumor development (500 ng of total RNA was spotted for all samples) and (E) quantification of three independent experiments. Background was removed and values were normalized to the levels of TERRA in controls of the same larval stages (gray line). F) qPCR analysis of DNA methylation (5-methylcytosine, 5mC-ChIP) status of the tert promoter in 5 dpf control (n = 3–5) and RAS (n = 3) fish larvae. Two regions of the promoter (see Figure 2C) were analyzed, the red color of region 3 indicates a putative CpG island. Values were normalized first to rps11 and then to 5mC vs. IgG enrichment, which is set at 1.0.

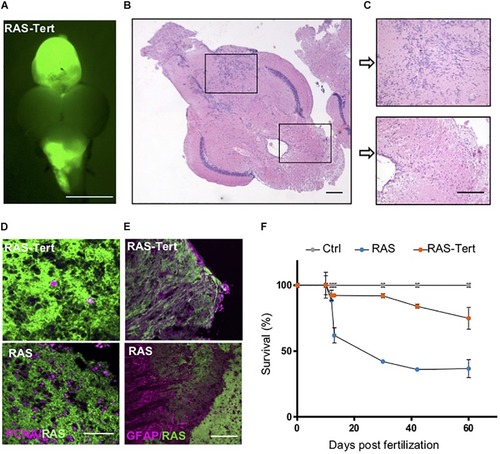
Expression of functional tert prolongs survival of fish with brain tumors. (A) Representative fluorescent image of a RAS-Tert brain tumor. Scale bar 0.5 mm. (B) Histological analysis of the RAS-Tert brain tumor shown in panel (A), (C) magnification of two area showing mild neoplastic abnormalities. Scale bars: 20 μm. (D) Immunofluorescence images showing the distribution of the proliferation marker PCNA (magenta) and (E) of the differentiation marker GFAP (magenta) in sections of tumors from RAS-Tert and RAS brains. Scale bar: 20 μm. (F) Survival curve during the entire larval period up to 2 m of Control, RAS and RAS-Tert fish (n = 45–60 larvae/genotype in three independent experiments). See also Supplementary Figure 3.

Expression of tert prevents the development of ALT and reduce genome instability in brain tumors. (A) Telomere length analysis by TRF in one control and two RAS-Tert tumors. The panel on the right shows TFR analysis obtained by graphing intensity versus DNA migration. The southern blot was sliced for better fitting. (B) C-Circle assay quantified by telomere qPCR in RAS and RAS-Tert tumors. Data are represented as C-Circle amount normalized to telomere content (TC) and single copy gene (rsp11). RAS n = 7; RAS-Tert n = 3. The dashed line indicates the level above which ALT activity is considered significant. Whiskers box plots represent median: min to max values. (C) Scatter plot of TERRA RNA-FISH signals measured as fluorescent intensity of single spots per nucleus in Control (n = 46), RAS (n = 50), and RAS-Tert (n = 62) cell nuclei from brains and brain tumors. Data from a single, representative experiment are shown (**p < 0.01). Bars represent mean ± SEM. (D) TERRA RNA dot blot from total RNA of control, RAS and RAS:Tert brains. 500 ng of total RNA was spotted for all samples. (E) Metaphase DNA FISH analysis using telomeric repeat probes of Tert-RAS and RAS juvenile brain tumors. Telomeric DNA (magenta), metaphase chromosomes, blue, and (F) magnified examples of aberrant telomere phenotype, signed by arrows: Signal free ends, fused telomeres, multimeric signal. (G) Quantitation of telomeric defects revealed in RAS (n = 95 chromosomes) and RAS-tert (n = 68 chromosomes) tumors. Multiple t-test, Holm Sidak methods, *p < 0.05. Bars represent mean ± SEM.

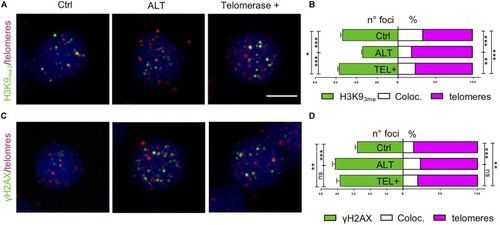
Expression of tert maintains telomeric heterochromatin in brain tumors. (A,C) Fluorescent microscope images of representative control, ALT, and telomerase + zebrafish brain tumor cells, stained via immunofluorescence (green) combined with telomere-FISH (magenta). Antibody against chromatin methylation marks (A, H3K9me3) and DNA damage marker (C, γH2AX), were used and counterstained with DAPI. Scale bar: 5 μm. (B,D) Immunofluorescence quantification expressed as the number of foci per nucleus (green), and percent of immunofluorescence foci (white) that colocalized at telomeres (magenta) per nucleus (n = 25–60 nuclei) for the corresponding images in panel (A,C). *p < 0.05, ***p < 0.001 between the indicated groups. Bars represent mean ± SEM.

Acknowledgments
This image is the copyrighted work of the attributed author or publisher, and ZFIN has permission only to display this image to its users. Additional permissions should be obtained from the applicable author or publisher of the image. Full text @ Front Cell Dev Biol