
FIGURE 7
- ID
- ZDB-IMAGE-200306-47
- Publication
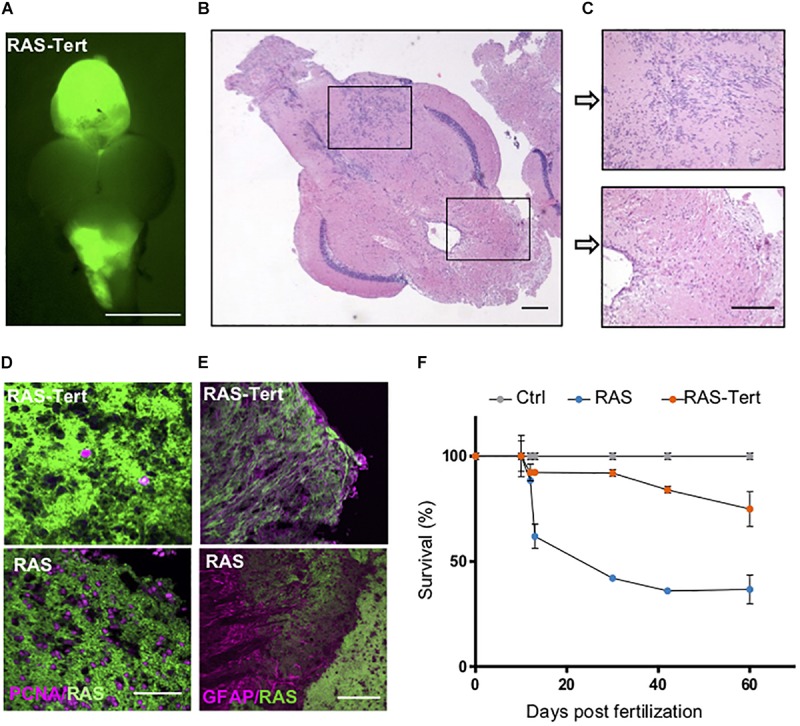
- Idilli et al., 2020 - Expression of tert Prevents ALT in Zebrafish Brain Tumors
- All Figures
- Figures for Idilli et al., 2020
|
FIGURE 7
Expression of functional