|
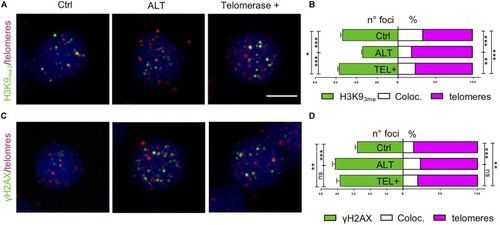
Expression of tert maintains telomeric heterochromatin in brain tumors. (A,C) Fluorescent microscope images of representative control, ALT, and telomerase + zebrafish brain tumor cells, stained via immunofluorescence (green) combined with telomere-FISH (magenta). Antibody against chromatin methylation marks (A, H3K9me3) and DNA damage marker (C, γH2AX), were used and counterstained with DAPI. Scale bar: 5 μm. (B,D) Immunofluorescence quantification expressed as the number of foci per nucleus (green), and percent of immunofluorescence foci (white) that colocalized at telomeres (magenta) per nucleus (n = 25–60 nuclei) for the corresponding images in panel (A,C). *p < 0.05, ***p < 0.001 between the indicated groups. Bars represent mean ± SEM.
|