IMAGE

FIGURE 5

ID
ZDB-IMAGE-200306-45
Genes
Source
Figures for Idilli et al., 2020
Image
Figure Caption

FIGURE 5

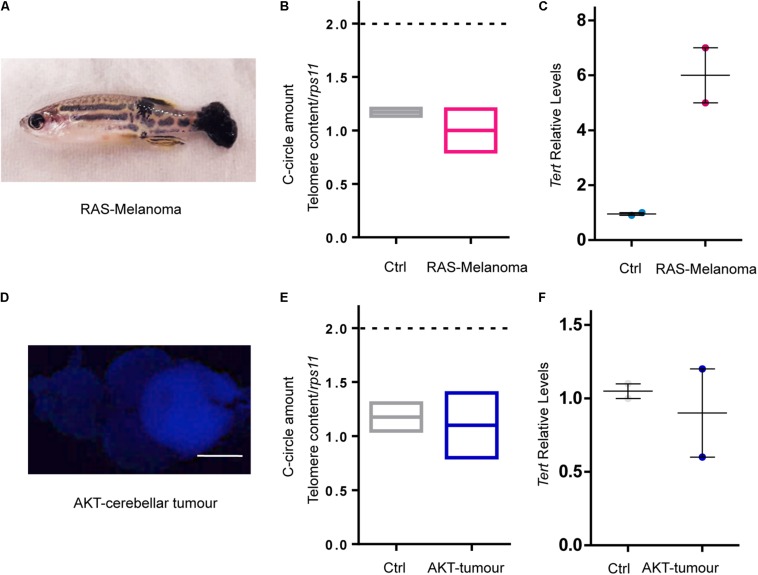
RAS expression is not the main driver of ALT in zebrafish cancer. (A) Image of a fish with melanoma induced by overexpression of oncogenic RAS. (B) C-Circle quantification by telomeric qPCR in control skin and melanoma (n = 2). (C) Measurement of tert expression in control skin and melanoma. Values were normalized first to rps11 mRNA and then to tert expression in control skin (n = 2). (D) Image of a zebrafish brain with an AKT – driven cerebellar tumor. Calibration bar: 0.5 mm. (E) C-Circle quantification by telomeric Q-PCR in control brain and AKT – driven cerebellar tumors (n = 2). (F) Measurement of tert expression in control brains and AKT – driven cerebellar tumors. Values were normalized first to rps11 and then to tert expression in control brains (n = 2). Bars represent mean ± SEM.

Figure Data
Acknowledgments
This image is the copyrighted work of the attributed author or publisher, and ZFIN has permission only to display this image to its users. Additional permissions should be obtained from the applicable author or publisher of the image. Full text @ Front Cell Dev Biol