|
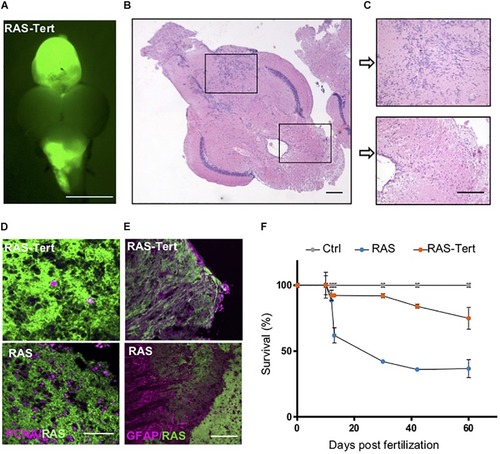
Expression of functional tert prolongs survival of fish with brain tumors. (A) Representative fluorescent image of a RAS-Tert brain tumor. Scale bar 0.5 mm. (B) Histological analysis of the RAS-Tert brain tumor shown in panel (A), (C) magnification of two area showing mild neoplastic abnormalities. Scale bars: 20 μm. (D) Immunofluorescence images showing the distribution of the proliferation marker PCNA (magenta) and (E) of the differentiation marker GFAP (magenta) in sections of tumors from RAS-Tert and RAS brains. Scale bar: 20 μm. (F) Survival curve during the entire larval period up to 2 m of Control, RAS and RAS-Tert fish (n = 45–60 larvae/genotype in three independent experiments). See also Supplementary Figure 3.
|