
- Title
-
Reelin Signaling Controls the Preference for Social Novelty in Zebrafish
- Authors
- Vecchia, E.D., Donato, V.D., Young, A.M.J., Bene, F.D., Norton, W.H.J.
- Source
- Full text @ Front. Behav. Neurosci.
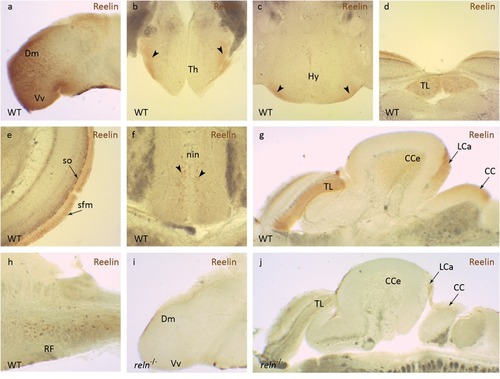
Reelin immunohistochemistry. Anti-Reelin antibody labeling of coronal and sagittal sections of the adult zebrafish brain. In wild-type anti-Reelin antibody labeling is seen in the EXPRESSION / LABELING:
PHENOTYPE:
|
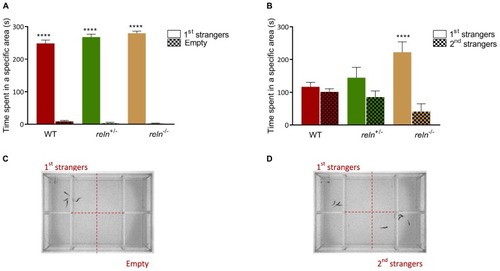
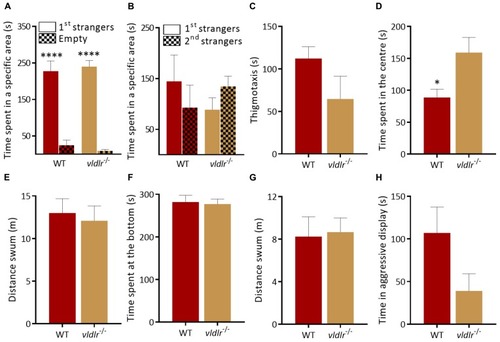
Social preference test. PHENOTYPE:
|
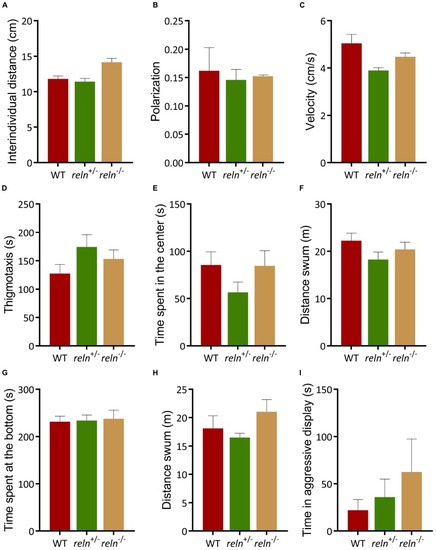
Behavior of |
Behavior of PHENOTYPE:
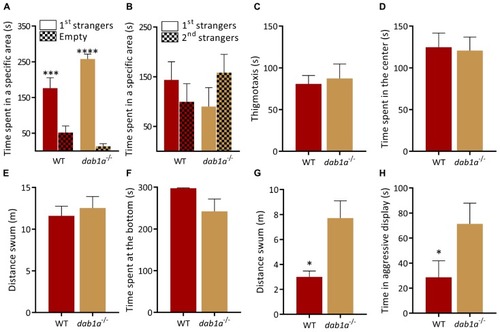
|
Behavior of PHENOTYPE:
|
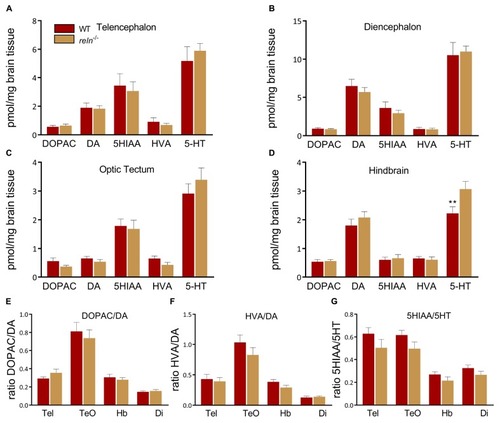
High pressure liquid chromatography. 5-HT levels are increased in the hindbrain of PHENOTYPE:
|
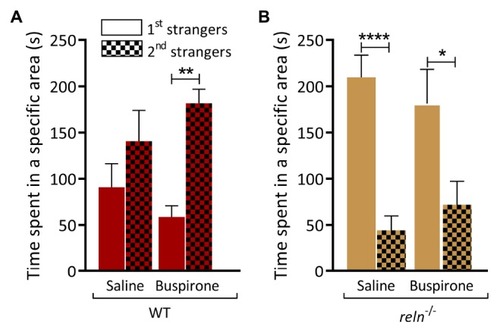
Buspirone increase the social preference for novelty in WT but not PHENOTYPE:
|
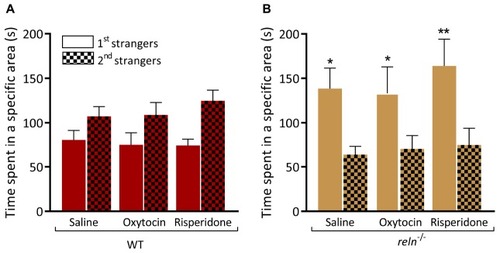
Oxytocin and risperidone do not rescue preference for social novelty. PHENOTYPE:
|