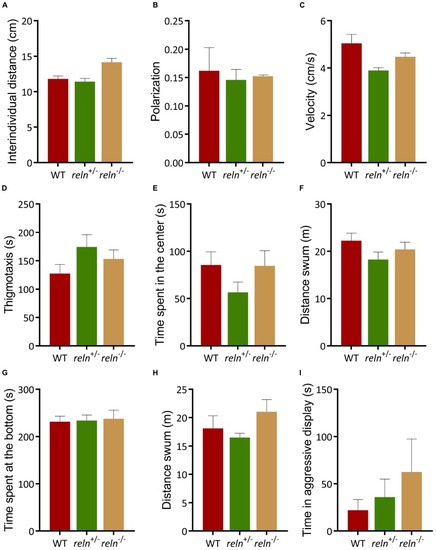
Behavior of reln+/– and reln–/– zebrafish. (A–C) Both genotypes shoal normally. (A) Inter-individual distance (Kruskal–Wallis test with Dunn’s multiple comparisons test: chi-square = 3.71, p > 0.99 for reln+/– and p = 0.36 for reln–/–); (B) Polarization (Kruskal–Wallis test with Dunn’s multiple comparisons (test: chi-square = 0, p > 0.99 for both genotypes) and (C) velocity [one-way ANOVA Dunnett’s multiple comparisons test: F(2,3) = 5.498, p = 0.09 for WT, p = 0.31 for reln+/– and p = 0.07 for reln–/–]. n = 2 groups of 5 WT, n = 2 groups of 5 reln+/– and n = 2 groups of 5 reln–/–. (D–F) Both reln+/– and reln–/– behave similarly to WT in the open field test. (D) Time at the side of the tank [thigmotaxis, one-way ANOVA Dunnett’s multiple comparisons test: F(2,33) = 1,687, p = 0.20, p = 0.13 for WT vs. reln+/– and p = 0.50 for WT vs. reln–/–]; (E) time spent in the center of the tank [one-way ANOVA Dunnett’s multiple comparisons test: F(2,33) = 1,431, p = 0.25 for WT, p = 0.25 for reln+/– and p = 0.99 for reln–/–]. (F) Locomotion is not affected in the open field test [one-way ANOVA Dunnett’s multiple comparisons test: F(2,33) = 1,625, p = 0.21, p = 0.14 for reln+/– and p = 0.61 for reln–/–]. n = 12 WT, n = 12 reln+/–, n = 12 reln–/–. (G,H) Both genotypes exhibit normal anxiety-like behavior. (G) Time at the bottom of a novel tank (Kruskal–Wallis test with Dunn’s multiple comparisons test: chi-square = 0,5705, p = 0.93 for reln+/– and p > 0.99 for reln–/–); (H) locomotion in a novel tank [one-way ANOVA Dunnett’s multiple comparisons test: F(2,35) = 1,54, p = 0.23 for WT, p = 0.75 for reln+/– and p = 0.43 for reln–/–) n = 13 wild-type, n = 13 reln+/–, n = 12 reln–/–. (I) No difference in aggression levels between WT, reln+/– and reln–/– (Kruskal–Wallis test with Dunn’s multiple comparisons test: chi-square = 3,372, p = 0.97 for reln+/– and p = 0.13 for reln–/–) n = 12 wild-type, n = 12 reln+/–, n = 8 reln–/–. Mean ± SEM.)
|
