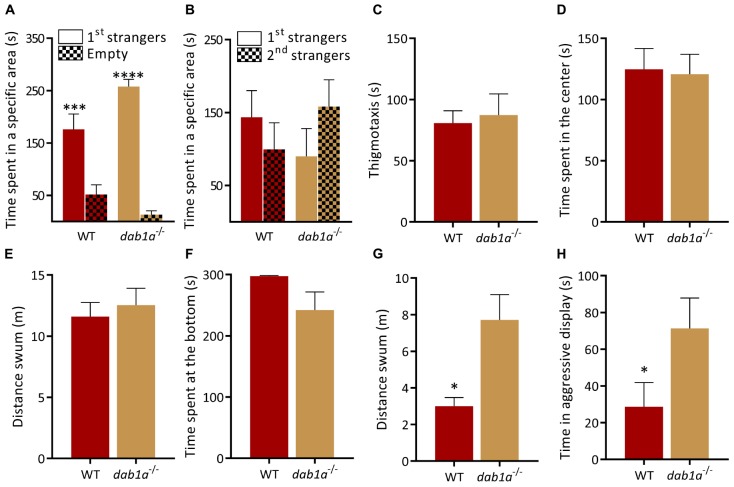
Behavior of dab1a–/– zebrafish. (A,B) Social preference test. (A) Both genotypes prefer to spend time near a group of unfamiliar fish [1st strangers; p = 0.0005 and p < 0.0001 respectively; two-way ANOVA followed by Sidak’s post hoc, genotype factor: F(1,30) = 0.9841, p = 0.3291, stranger factor: F(1,30) = 72.81, p < 0.0001, interaction genotype × stranger: F(1,30) = 7.716, p = 0.0093]. (B) WT and dab1a–/– spend equal time near both groups when a second unfamiliar group is added [p = 0.61 for WT and p = 0.44 for dab1a–/–; two-way ANOVA followed by Sidak’s post hoc, genotype factor: F(1,30) = 0.004, p = 0.95, stranger factor: F(1,30) = 0.1016, p = 0.75, interaction genotype × stranger: F(1,30) = 2.175, p = 0.15. n = 10 wild-type and n = 7 dab1a–/–]. (C–E)dab1a–/– exhibit normal behavior in the open field test. (C) Time at side of the tank [thigmotaxis, t-test (Welch): t(0.3262) = 9.971, p = 0.75] and (D) time in center of the tank [t-test (Welch): t(0.1684) = 14.64, p = 0.87] (E) locomotion [t-test (Welch): t(0.5277) = 13.05, p = 0.61. n = 10 wild-type and n = 7 dab1a–/–]. (F)dab1a–/– exhibit normal anxiety-like behavior. Time at the bottom of novel tank (Mann–Whitney test: U = 17, p = 0.06). (G)dab1a–/– fish are more active than WT in the NTT [t-test (Welch): t(3.234) = 7.409, p = 0.0133. n = 10 wild-type and n = 7 dab1a–/–]. (H)dab1a–/– display heightened aggression levels compared to WT (Mann–Whitney test: U = 11.5, p = 0.0445. n = 10 wild-type and n = 7 dab1a–/–). ∗p < 0.05, ∗∗∗p < 0.001, ****p < 0.0001. Mean ± SEM.
This image is the copyrighted work of the attributed author or publisher, and
ZFIN has permission only to display this image to its users.
Additional permissions should be obtained from the applicable author or publisher of the image.
Full text @ Front. Behav. Neurosci.
Your Input Welcome
Thank you for submitting comments. Your input has been emailed to ZFIN curators who may contact you if
additional information is required.
Oops. Something went wrong. Please try again later.