
- Title
-
Frontline Science: Antagonism between regular and atypical Cxcr3 receptors regulates macrophage migration during infection and injury in zebrafish
- Authors
- Sommer, F., Torraca, V., Kamel, S.M., Lombardi, A., Meijer, A.H.
- Source
- Full text @ J. Leukoc. Biol.

ZFIN is incorporating published figure images and captions as part of an ongoing project. Figures from some publications have not yet been curated, or are not available for display because of copyright restrictions. PHENOTYPE:
|
|
ZFIN is incorporating published figure images and captions as part of an ongoing project. Figures from some publications have not yet been curated, or are not available for display because of copyright restrictions. EXPRESSION / LABELING:
PHENOTYPE:
|
|
|
|
PHENOTYPE:
|
|
|
PHENOTYPE:
|
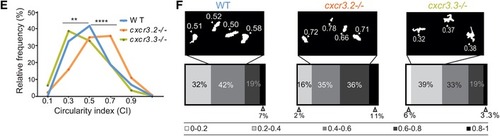
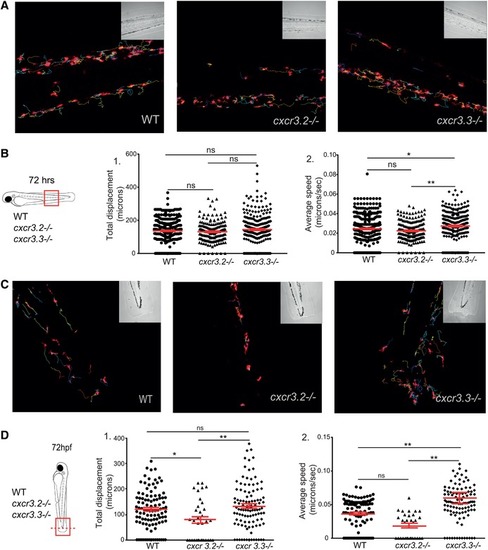
Cxcr3.3‐depleted macrophages move faster than WT cells under basal conditions and upon mechanical damage and have a lower CI. Panel A shows representative images of tracks of macrophages of 3‐day‐old larvae from the 3 genotypes under unchallenged conditions (random patrolling). Macrophages were tracked for 3 h and images were taken every 2 min. Graphs in B show the total displacement of all cells tracked shortly after amputation in each group throughout 3 h (B‐2) and the average speed of each cell (B‐2). In this case, macrophages were tracked for 1.5 h and images were acquired every 1 min. There was no significant difference between the groups in terms of total cell displacement (B‐1.), however cxcr3.3–/– macrophages did move faster than the remaining groups as indicated by the dot‐plots in (B‐2.). Panel C shows representative images of macrophage tracks of the 2 groups directly after a tail amputation. The tracks of cxcr3.2–/– macrophages were shorter than those of the remaining groups (D‐1.) and cxcr3.3–/– macrophages moved faster than the other 2 groups when mechanical damage was inflicted (D‐2.). Data of unchallenged larvae were collected from 2 independent replicates (5 larvae per group each) and for the tail‐amputation model data from 3 independent replicates (4 larvae per group each) were pooled together for analysis One‐way ANOVA was performed to test for significance (ns P > 0.05, *P ≤ 0.05, **P ≤ 0.01) and data are shown as mean ± sem. The CI distributions of both cxcr3.2–/– and cxc3.3–/– differ from the WT control but are skewed in opposite directions as low CI values are more frequent in cxcr3.3 mutants than in WT and high CI values are more frequent in cxcr3.2 mutants as shown by the curves (E). Panel F shows representative images of the most frequent CI interval in each group and the bar displays the percentage of each CI category within each genotype. A Kolmogorov‐Smirnov test was used to evaluate the CI value distributions using the WT data as reference distribution (**P ≤ 0.01, ****P ≤ 0.0001) |
|
|