
- Title
-
Basal epithelial tissue folding is mediated by differential regulation of microtubules
- Authors
- Visetsouk, M.R., Falat, E.J., Garde, R.J., Wendlick, J.L., Gutzman, J.H.
- Source
- Full text @ Development
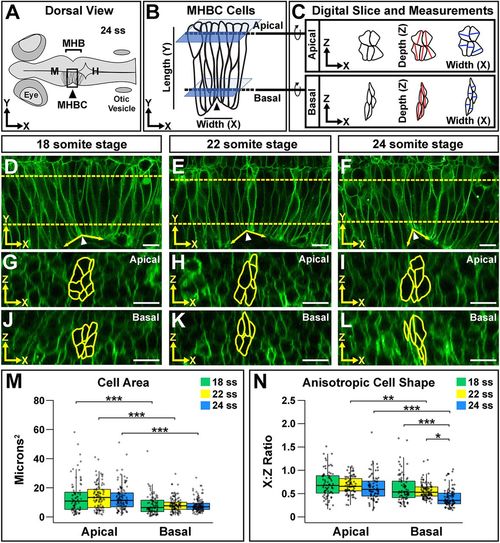
Neuroepithelial cell shape analysis reveals anisotropic shape that is enhanced basally during morphogenesis. (A) Diagram of a 24 ss zebrafish embryo. H, hindbrain; M, midbrain. (B) Close-up view of the boxed MHBC region in A showing cell orientation with length (apical-basal, y-axis) and width (anterior-posterior, x-axis) indicated. Dashed lines indicate where apical and basal digital orthogonal slices were generated for analyses. (C) Digital slices were rotated 90° to the right to reveal apical and basal cell shape in the xz plane. Cell area was measured by outlining cells. Cell depth was measured at the deepest point of the cell within 45° of the z-axis (red lines). Cell width was measured at the widest point of the cell along the x-axis, perpendicular to the depth measurement (blue lines). See also Fig. S1. (D-L) Live confocal images of wild-type embryos injected with memCherry mRNA at 18 ss (D,G,J), 22 ss (E,H,K) and 24 ss (F,I,L). Apical (G-I) and basal (J-L) digital slices, taken at the locations marked by the dashed lines in D-F at the indicated time points, are shown. MHBC cells are outlined in yellow. (M) Quantification of apical and basal cell area. (N) Quantification of anisotropic cell shape using the width (x) to depth (z) ratio (x:z ratio). Boxplots indicate the 25th and 75th percentiles and the median. Three independent experiments are represented. 18 ss, n=6; 22 ss, n=6; 24 ss, n=6. *P<0.05, **P<0.01, ***P<0.005. Arrowheads indicate MHBC and arrows indicate MHB tissue angle. Anterior is to the left in all images. Scale bars: 10 μm. |
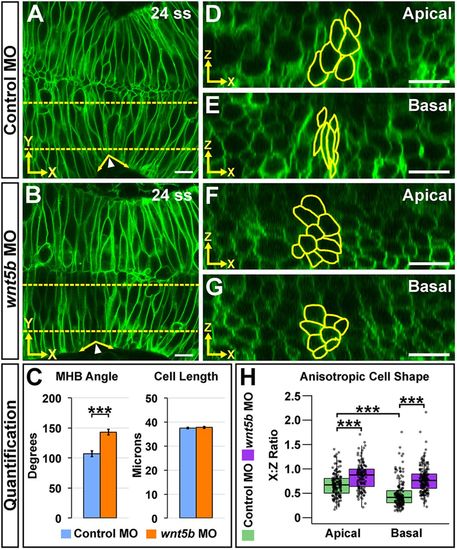
Wnt5b is required for anisotropic cell shape both apically and basally at the MHBC. (A,B) Live confocal images of 24 ss wild-type embryos co-injected with memGFP and control MO (A) or wnt5b MO (B). (C) Quantification of MHB tissue angle and MHBC cell length (y-axis). Data are represented as mean±s.e.m. from eight independent experiments. (D,E) Representative apical (D) and basal (E) digital slices of control morphants. (F,G) Representative apical (F) and basal (G) digital slices of wnt5b morphants. (H) Quantification of anisotropic cell shape using x:z ratio. MHBC cells are outlined in yellow. Boxplots indicate the 25th and 75th percentiles and the median. Eight independent experiments are represented. Control MO, n=10; wnt5b MO, n=10. ***P<0.005. Arrowheads indicate MHBC and arrows indicate MHB tissue angle. Scale bars: 10 μm. |
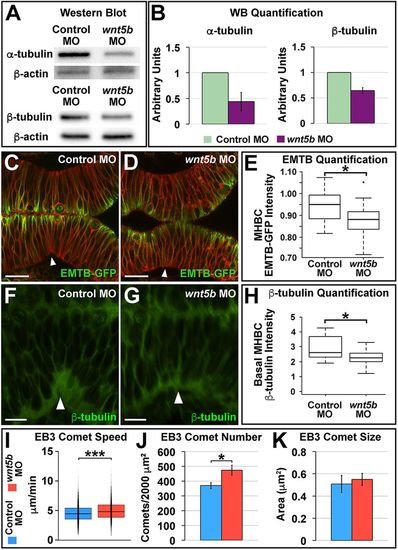
Wnt5b regulates tubulin protein levels and microtubule dynamics at the MHB. (A) Representative western blot for α-tubulin and β-tubulin, with β-actin as the control, comparing control MO- and wnt5b MO-injected embryos. Head tissue protein was analyzed. (B) Quantification of at least three independent western blot (WB) experiments; α-tubulin and β-tubulin levels were normalized to β-actin. Data are represented as mean±s.d. (C,D) Representative live confocal images showing 10 μm average intensity projections at 22-24 ss of wild-type embryos co-injected with EMTB-GFP, memCherry, and control MO (C) or wnt5b MO (D). (E) Quantification of the normalized MHBC EMTB-GFP intensity in control versus wnt5b morphants (Fig. S4A-C). Boxplots indicate the 25th and 75th percentiles and the median. Three independent experiments are represented. Control MO, n=10; wnt5b MO, n=7. Scale bars: 20 μm. (F,G) Representative confocal images of β-tubulin immunostaining showing 10 μm average intensity projections at 24 ss of wild-type embryos injected with either control MO (F) or wnt5b MO (G). (H) Quantification of the normalized basal MHBC intensity in control versus wnt5b morphants. Basal MHBC intensity was divided by the intensity in the middle of the cell (see Fig. S4D-F). Boxplots indicate the 25th and 75th percentiles and the median. Three independent experiments are represented. Control MO, n=7; wnt5b MO, n=6. Scale bars: 10 μm. (I-K) Quantification of control versus wnt5b morphants for EB3-GFP comet speed (I), EB3-GFP comet number (J) and EB3-GFP comet size (K). See also Movies 1-4. Boxplots indicate the 25th and 75th percentiles and the median. Three independent experiments are represented. In J,K, data are represented as mean±s.e.m. EB3-GFP comet speed: control MO, n=11; wnt5b MO, n=7. EB3-GFP comet number and comet size: control MO, n=11; wnt5b MO, n=11. *P<0.05, ***P<0.005. Arrowheads indicate MHBC. |
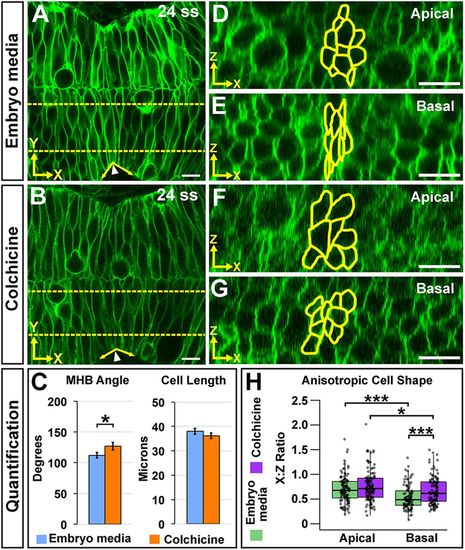
Microtubule polymerization is required for basal anisotropic cell shape at the MHBC. (A,B) Live confocal images of 24 ss memGFP-injected wild-type embryos treated at 18 ss with embryo media (A) or colchicine (B). (C) Quantification of MHB tissue angle and MHBC cell length. Data are represented as mean±s.e.m. of three independent experiments. (D,E) Apical (D) and basal (E) digital slices of embryo media-treated embryos. (F,G) Apical (F) and basal (G) digital slices of colchicine-treated embryos. MHBC cells are outlined in yellow. (H) Quantification of anisotropic cell shape using x:z ratio. Boxplots indicate the 25th and 75th percentiles and the median. Three independent experiments are represented. Control embryo media, n=7; colchicine, n=8. *P<0.05, ***P<0.005. Arrowheads indicate MHBC and arrows indicate MHB tissue angle. Scale bars: 10 μm. |
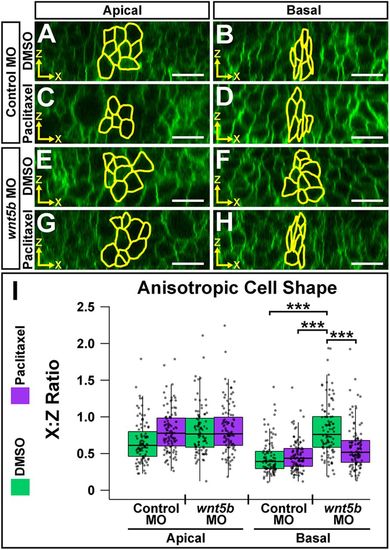
Microtubule filament stability is required for Wnt5b-mediated basal anisotropic cell shape. (A-H) Digital slices from z-series images of wild-type embryos co-injected with memGFP and control MO (A-D) or wnt5b MO (E-H). Embryos were treated at 18 ss with DMSO (A,B,E,F) or paclitaxel (C,D,G,H) and imaged at 24 ss. MHBC cells are outlined in yellow in apical (A,C,E,G) and basal (B,D,F,H) digital slices. (I) Quantification of anisotropic cell shape using x:z ratio. Apical measurements were compared post-hoc with the control MO DMSO apical condition. Basal measurements were compared post-hoc with the wnt5b MO DMSO basal condition. Boxplots indicate the 25th and 75th percentiles and the median. Four independent experiments are represented. Control DMSO, n=7; control paclitaxel, n=9; wnt5b MO DMSO, n=8; wnt5b MO paclitaxel, n=8. ***P<0.005. Scale bars: 10 μm. |
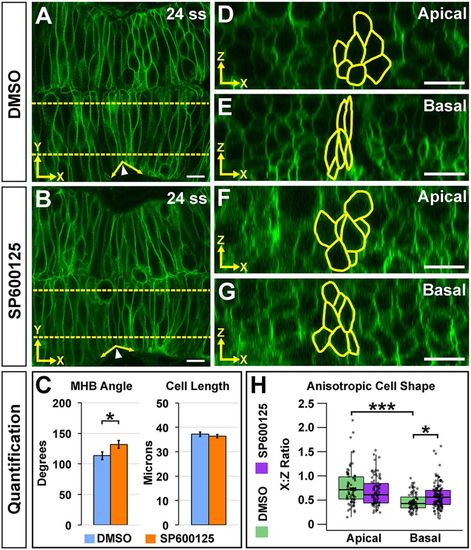
JNK is required for basal anisotropic MHBC cell shape. (A,B) Live confocal imaging of 24 ss embryos injected with memGFP and treated with DMSO (A) or SP600125 (B). (C) Quantification and comparison of MHB angle and length. Data are represented as mean±s.e.m. of three independent experiments. (D,E) Apical (D) and basal (E) digital slices of DMSO-treated embryos at 24 ss. (F,G) Apical (F) and basal (G) digital slices of SP600125-treated embryos at 24 ss. MHBC cells are outlined in yellow in apical (D,F) and basal (E,G) digital slices. (H) Quantification of anisotropic cell shape using x:z ratio in DMSO- and SP600125-treated embryos. Boxplots indicate the 25th and 75th percentiles and the median. Three independent experiments are represented. DMSO, n=6; SP600125, n=6. *P<0.05, ***P<0.005. Arrowheads indicate MHBC and arrows indicate MHB tissue angle. Scale bars: 10 μm. |
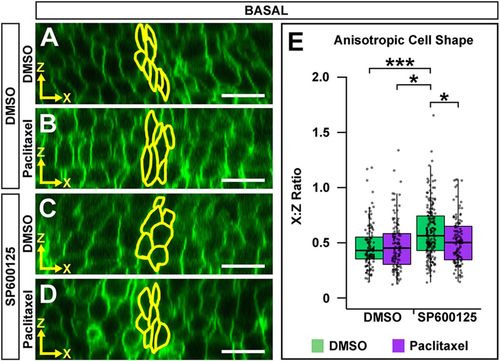
Microtubule filament stability is required for JNK-mediated basal anisotropic cell shape. (A-D) Digital slices from z-series images of memGFP-injected wild-type embryos treated at 16 ss with DMSO (A,B) or SP600125 (C,D). Embryos were then treated at 18 ss with DMSO (A,C) or paclitaxel (B,D) and imaged at 24 ss. MHBC cells are outlined in yellow. (E) Quantification of anisotropic cell shape. All basal x:z ratios were compared post-hoc with the SP600125/DMSO treatment. Boxplots indicate the 25th and 75th percentiles and the median. Four independent experiments are represented. DMSO/DMSO n=6; DMSO/paclitaxel n=6; SP600125/DMSO n=10; SP600125/paclitaxel n=7. *P<0.05, ***P<0.005. Scale bars: 10 μm. |