
|
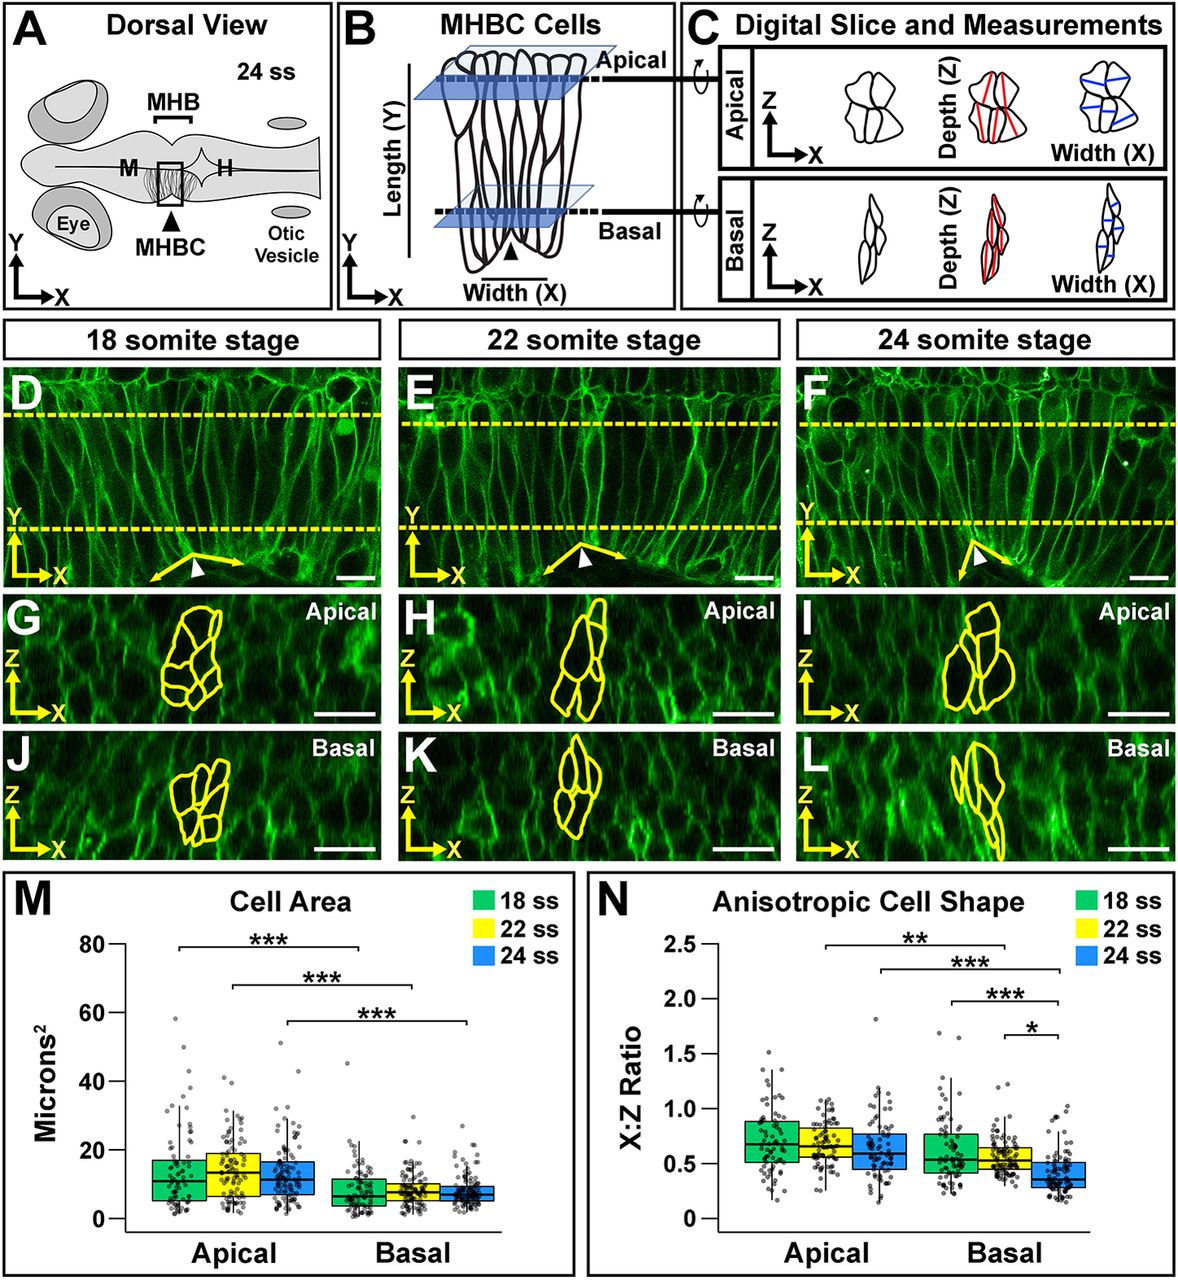
Fig. 1
Neuroepithelial cell shape analysis reveals anisotropic shape that is enhanced basally during morphogenesis. (A) Diagram of a 24 ss zebrafish embryo. H, hindbrain; M, midbrain. (B) Close-up view of the boxed MHBC region in A showing cell orientation with length (apical-basal, y-axis) and width (anterior-posterior, x-axis) indicated. Dashed lines indicate where apical and basal digital orthogonal slices were generated for analyses. (C) Digital slices were rotated 90° to the right to reveal apical and basal cell shape in the xz plane. Cell area was measured by outlining cells. Cell depth was measured at the deepest point of the cell within 45° of the z-axis (red lines). Cell width was measured at the widest point of the cell along the x-axis, perpendicular to the depth measurement (blue lines). See also Fig. S1. (D-L) Live confocal images of wild-type embryos injected with memCherry mRNA at 18 ss (D,G,J), 22 ss (E,H,K) and 24 ss (F,I,L). Apical (G-I) and basal (J-L) digital slices, taken at the locations marked by the dashed lines in D-F at the indicated time points, are shown. MHBC cells are outlined in yellow. (M) Quantification of apical and basal cell area. (N) Quantification of anisotropic cell shape using the width (x) to depth (z) ratio (x:z ratio). Boxplots indicate the 25th and 75th percentiles and the median. Three independent experiments are represented. 18 ss, n=6; 22 ss, n=6; 24 ss, n=6. *P<0.05, **P<0.01, ***P<0.005. Arrowheads indicate MHBC and arrows indicate MHB tissue angle. Anterior is to the left in all images. Scale bars: 10 μm.