- Title
-
Cx43-Dependent Skeletal Phenotypes Are Mediated by Interactions between the Hapln1a-ECM and Sema3d during Fin Regeneration
- Authors
- Govindan, J., Tun, K.M., Iovine, M.K.
- Source
- Full text @ PLoS One
|
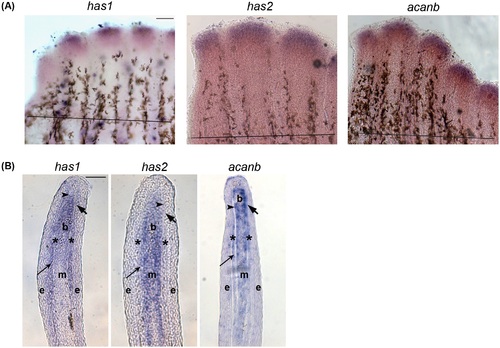
In situ hybridization showing the expression of Hapln1a-ECM components on 5 dpa regenerating fins. (A) Whole mount in situ hybridization of components of the Hapln1a-ECM. The genes has1, has2, and acanb are expressed during fin regeneration. The amputation plane is indicated by a black line in all the panels. Scale bar represents 100µm. (B) In situ hybridization on a WT 5 dpa cryo-section reveals compartmental expression of has1, has2, and acanb. Blastema (b), mesenchyme (m), and skeletal precursor cells (*). The thick arrow identifies the basal layer of the epidermis, which underlies the epidermis (e). The thin arrow identifies lepidotrichia and the arrowhead identifies the actinotrichia. Scale bar represents 50µm. EXPRESSION / LABELING:
|
|
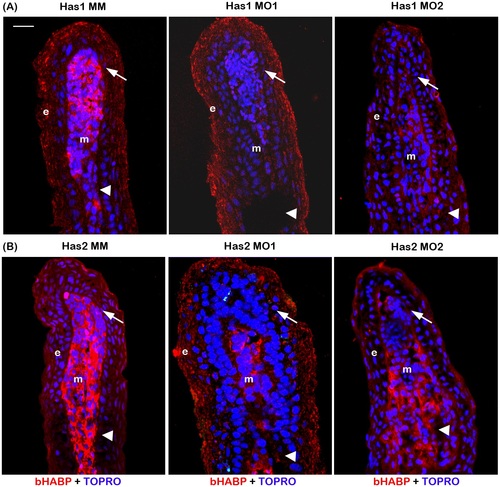
Morpholino mediated knockdown of has1 and has2 results in reduced HA. (A) Morpholino mediated knockdown of has1 results in reduced HA. Longitudinal section of fin rays treated with has1 control morpholino (Has1 MM) and has1 target morpholinos (Has1 MO1 and Has1 MO2). (B) Morpholino mediated knockdown of has2 results in reduced HA. Longitudinal section of fin rays treated with has2 control morpholino (Has2 MM) and has2 target morpholinos (Has2 MO1 and Has2 MO2). HA is detected by histochemical staining using biotinylated HABP and Streptavidin-Alexa 546. TO-PRO is used as the counterstain and detects DNA (blue). Compared to Has1 MM and Has2 MM treated fins, Has1 MO and Has2 MO treated fins exhibit reduced staining for HA. Arrow identifies the basal layer of epithelium; arrow head identifies the bone; m, mesenchyme; e, epithelium. Scale bar represents 20 µm. |
|
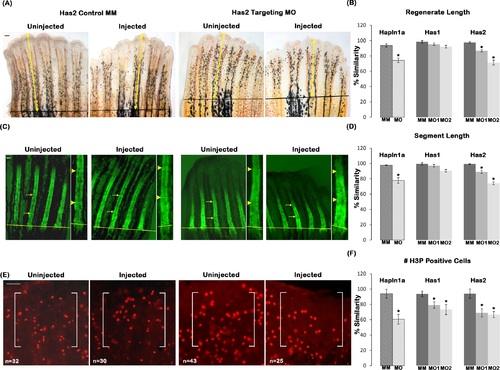
Reduced HA contributes to Hapln1a knockdown phenotypes. (A) Representative images showing regenerate length for Has2 MM and Has2 MO treated fins. Total regenerate length was evaluated by measuring the distance between the amputation plane (black line) to the distal end of the fin using the 3rd fin ray (marked by yellow arrows). (B) Bar graph shows that regenerate length is significantly reduced upon has2 knockdown but not in has1 knockdown using two independent MOs for each gene (MO1 and MO2). The hashed bars indicate the extent of hapln1a knockdown effect compared to has1 and has2 knockdowns. (C) Representative calcein stained fins showing segment length for Has2 MM and Has2 MO treated fins. Segment length was evaluated by measuring the distance between first two joints in the regenerate (marked by yellow arrows). An enlarged inset for the measured segment is provided and the joints are indicated by yellow arrow heads. (D) Bar graph shows that segment length is significantly reduced upon has2 knockdown but not in has1 knockdown using two independent MOs for each gene (MO1 and MO2). The hashed bars indicate the extent of hapln1a knockdown effect compared to has1 and has2 knockdowns. (E) Representative H3P stained fins showing H3P positive cells for Has2 MM and Has2 MO treated fins. H3P positive cells were counted within a defined area (marked by white brackets). (F) Bar graph shows that cell proliferation is significantly reduced upon has1 and has2 knockdown using two independent MOs for each gene (MO1 and MO2). The hashed bars indicate the extent of hapln1a knockdown effect, compared to has1 and has2 knockdowns. Students t-test was performed (p<0.05) to determine significance, and the error bars indicate standard error of the mean. Scale bar is 50 µm in all panels. PHENOTYPE:
|

ZFIN is incorporating published figure images and captions as part of an ongoing project. Figures from some publications have not yet been curated, or are not available for display because of copyright restrictions. PHENOTYPE:
|
|
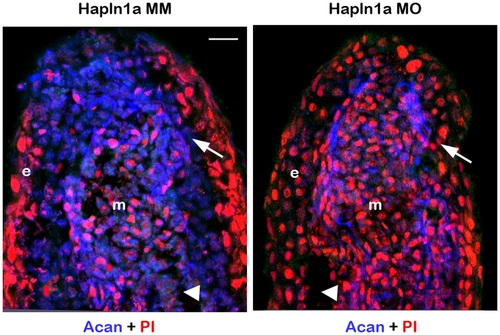
Morpholino mediated knockdown of hapln1a results in reduced Acan protein levels. Longitudinal section of fin rays treated with hapln1a control morpholino (Hapln1a MM) and hapln1a targeting morpholino (Hapln1a MO). Immuno-staining for Acan (blue) and counterstained for nuclei with Propidium Iodide (PI, red). Compared to the control Hapln1a MM treated fins, Hapln1a MO treated fins show reduced staining for Acan. Arrow identifies the basal layer of epithelium; arrow head identifies the bone; m, mesenchyme; e, epithelium. Arrow identifies the basal layer of epithelium; arrow head identifies the bone; m, mesenchyme; e, epithelium. Scale bar represents 20 µm. |
|
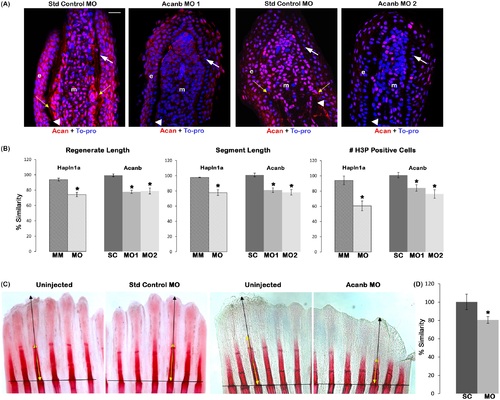
Reduced Acan contributes to Hapln1a knockdown phenotypes. (A) Longitudinal section of fin rays treated with standard control morpholino (Standard control MO) and acanb ATG-blocking morpholino (Acanb MO1) or splice blocking morpholino (Acanb MO2). Immuno-staining for Acan (red) and counterstained for nuclei with To-pro (blue). Compared to the standard MO treated fins, Acanb MO treated fins show reduced staining for Acan. White arrow identifies the basal layer of epithelium; yellow arrow identifies Acan staining in the lepidotrichia, arrow head identifies the bone; m, mesenchyme; e, epithelium. Scale bar represents 20 µm. (B) Bar graph shows that regenerate length, segment length and cell proliferation are significantly reduced upon acanb knockdown using both MO1 and MO2. The mean of percent similarity for the MO treated experimental group and the corresponding control group were estimated and compared. Statistical significance was determined using the student′s t-test (P<0.05) and the error bars represent standard error of mean. The hashed bars indicate the extent of hapln1a knockdown effect compared to acanb knockdown. (C) Representative alizarin red stained fins showing extent of bone calcification. The black line indicates the amputation plane. (D) The extent of mineralization was calculated as the ratio of the zone of mineralization (extent of detectable alizarin red staining length) to the total regenerate length. The mean of percent similarity for the MO treated experimental group and the corresponding control group were estimated and compared, and the statistical significance between the groups was determined using two tailed unpaired student′s t-test (P<0.05) and the error bars indicate the standard error of mean. |

ZFIN is incorporating published figure images and captions as part of an ongoing project. Figures from some publications have not yet been curated, or are not available for display because of copyright restrictions. PHENOTYPE:
|
|
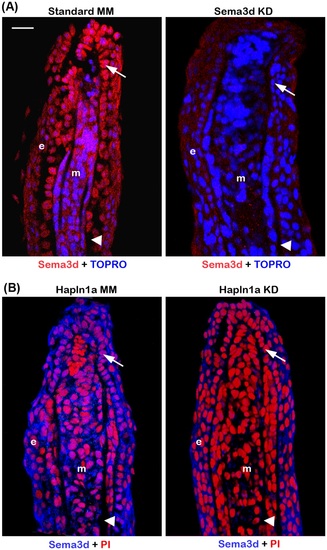
Morpholino mediated knockdown of hapln1a results in reduced Sema3d protein levels. (A) Longintudinal section of fin rays treated with control morpholino and sema3d targeting morpholino (Sema3d KD). Immuno-staining for Sema3d (red) and counterstained for nuclei with TOPRO (blue). Compared to the control MM treated fins, Sema3d MO treated fins show reduced staining for Sema3d. (B) Longitudinal section of fin rays treated with hapln1a control morpholino (Hapln1a MM) and hapln1a targeting morpholino (Hapln1a MO). Immuno-staining for Sema3d (blue) and counterstained for nuclei with Propidium Iodide (PI, red). Compared to the control MM treated fins, Hapln1a MO treated fins show reduced staining for Sema3d. Arrow identifies the basal layer of epithelium; arrow head identifies the bone; m, mesenchyme; e, epithelium. Scale bar represents 20 µm. |
|
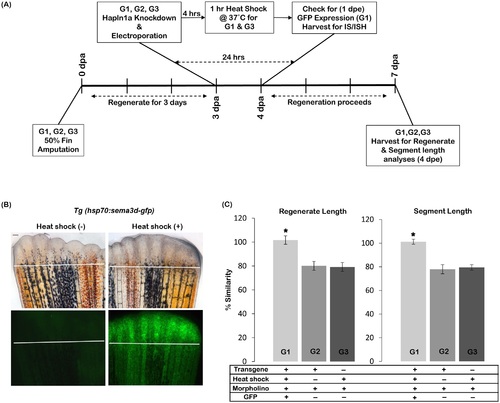
Sema3d overexpression rescues hapln1a knockdown phenotypes. (A) Experimental design. Three groups of fish were analysed: G1, G2 and G3. Fins from all three groups were amputated at 50% level. On 3 dpa all animals (G1, G2 and G3) were treated for hapln1a knockdown. Four hours post knockdown, G1 and G3 animals were heat shocked for 1hr at 37°C. G2 animals were not treated for heat shock. The following day, 1 dpe, G1 animals were selected for GFP positive fins. For GFP detection, immuno-staining (IS) and in situ hybridization experiments (ISH), fins were harvested 1 dpe and for regenerate and segment length analyses fins were harvested at 4 dpe. (B) Heat shock induces Sema3d-GFP (green) expression in Tg(hsp70:sema3d-gfp). GFP is not detected in the absence of heat shock. The white line indicates the amputation plane. Scale bar represents 50µm. (C) Following hapln1a knockdown the experimental group (G1) that is positive for both transgene and heat shock alone shows rescue for the phenotypes (i.e., shows high percent similarity compared to the un-injected side) whereas the control groups either negative for heat shock (G2) or negative for transgene (G3) fail to show rescue (i.e., shows reduced percent similarity compared to the un-injected side). Students t-test was performed (p<0.05) to determine significance, and the error bars indicate standard error of mean. |
|
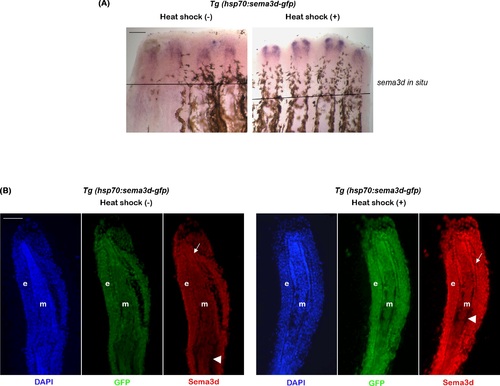
Heat shock induces upregulation of sema3d mRNA and Sema3d protein in Tg(hsp70:sema3d-gfp). (A) Whole mount in situ hybridization shows increased expression of sema3d mRNA in heat shock treated fins compared to the untreated fins. Black line indicates amputation plane. (B) Immuno-staining analysis of longitudinal fin sections reveal increased expression of GFP (green) and Sema3d (Red) in heat shock treated fins compared to the untreated fins. DAPI (blue) is used as the counter stain and stains the nuclei. Arrows indicate basal layer of epithelium and arrow head marks the bone. e, epidermis; m, mesenchyme. Scale bar represents 100µm in both panels. |

