
- Title
-
Polyamine biosynthesis is critical for growth and differentiation of the pancreas
- Authors
- Mastracci, T.L., Robertson, M.A., Mirmira, R.G., Anderson, R.M.
- Source
- Full text @ Sci. Rep.
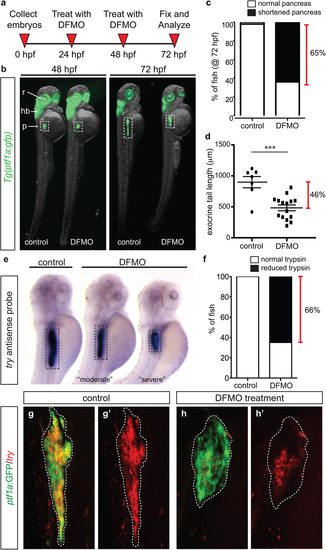
Inhibition of polyamine biosynthesis alters exocrine pancreas development. (a) Drug treatment strategy. (b) Whole body and exocrine pancreas phenotype in control and DFMO-treated Tg(ptf1a:gfp) embryos at 48 hpf and 72 hpf. (c) The number of fish at 72 hpf with a normal (n = 30) or a shortened (n = 45) exocrine pancreas, as observed by expression of ptf1a:GFP. (d) Quantification of exocrine pancreas length in control (n = 7) and DFMO-treated (n = 16) Tg(ptf1a:gfp) embryos at 72 hpf (p = 0.0002); this represents a 46% difference in exocrine pancreas length. (e) Representative images from in situ hybridization for expression of the gene encoding trypsin (try) on control and DFMO-treated embryos at 72 hpf. (f) Number of control (n = 24) and DFMO-treated (n = 24) embryos with a normal or reduced trypsin (try) expression domain at 72 hpf. Wholemount fluorescent in situ hybridization for trypsin gene expression (try) was performed on (g) control and (h) DFMO-treated Tg(ptf1a:gfp) embryos. The corresponding maximum intensity projection of try expression in (g′) control and (h′) DFMO-treated Tg(ptf1a:gfp) embryos; the white dotted line outlines the ptf1a:GFP + exocrine pancreas domain. r, retina; hb, hindbrain; p, pancreas. EXPRESSION / LABELING:
PHENOTYPE:
|
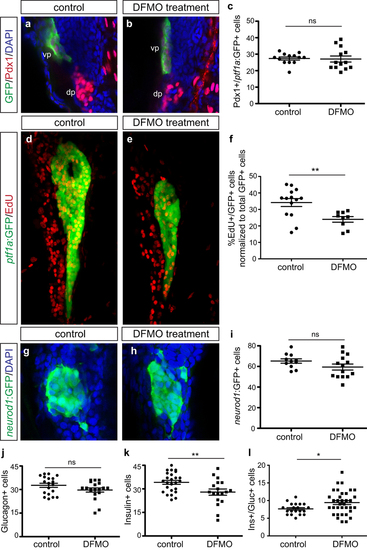
Exocrine and endocrine cell differentiation but not specification is disrupted by DFMO. Representative images of (a) control and (b) DFMO-treated Tg(ptf1a:gfp) embryos stained for Pdx1 and ptf1a:GFP to identify co-expressing ventral pancreas progenitor cells. (c) Quantification of Pdx1+/ ptf1a :GFP + progenitor cells in control (n = 13) and DFMO-treated (n = 13) embryos at 33 hpf (p = 0.8823). Representative images of pancreas from (d) control and (e) DFMO-treated Tg(ptf1a:gfp) embryos at 72 hpf after EdU incorporation. (f) Quantification of the number of EdU-expressing ptf1a:GFP + exocrine cells, normalized to total GFP + cells, in control (n = 14) and DFMO-treated (n = 9) embryos (p = 0.0055). Representative images of neurod1:GFP + endocrine (islet) cells in (g) control and (h) DFMO-treated Tg(neurod1:gfp) embryos at 72 hpf. (i) Quantitation of the neurod1:GFP + endocrine cell population at 72 hpf in control (n = 11) and DFMO-treated (n = 14) embryos (p = 0.1392). Specific endocrine cell populations were also quantified, including (j) Glucagon + α cells (n = 19 for both groups; p = 0.1168), (k) Insulin + β cells (control n = 25; DFMO n = 18; p = 0.0079), and (l) Insulin+/Glucagon + co-expressing cells (control n = 20; DFMO n = 35; p = 0.0282). *p < 0.05, **p < 0.01, ***p < 0.001; ns, not significant; dp, dorsal pancreas; vp, ventral pancreas. EXPRESSION / LABELING:
PHENOTYPE:
|
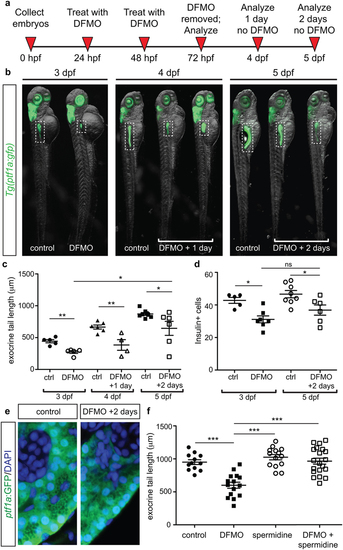
Withdrawal of DFMO treatment causes partial recovery, and spermidine supplementation rescues phenotypic defects. (a) Strategy for DFMO treatment and withdrawal. (b) Representative images of control and DFMO-treated Tg(ptf1a:gfp) embryos after 0, 1, or 2 days of DFMO treatment withdrawal; white dotted box denotes the location of the pancreas (c) Quantification of exocrine pancreas length in control (n = 5) and DFMO-treated (n = 5) Tg(ptf1a:gfp) embryos at 3 dpf (p = 0.001); control (n = 6) and DFMO-treated (n = 4) Tg(ptf1a:gfp) embryos at 4 dpf (one day after DFMO was removed)(p = 0.0064); control (n = 7) and DFMO-treated (n = 6) Tg(ptf1a:gfp) embryos at 5 dpf (two days after DFMO was removed)(p = 0.0381); a significant increase in exocrine pancreas length was observed between embryos that were DFMO-treated compared with DFMO + 2 day withdrawal (p = 0.0226). (d) The insulin + β cell population was also quantified for 3 dpf control (n = 5) and DFMO-treated embryos (n = 7) (p < 0.05), as well as 5 dpf control (n = 8) and DFMO + 2 day withdrawal embryos (n = 6) (p < 0.05); no significant difference in β cell number was observed after 2 days of DFMO withdrawal (p = 0.1512). (e) Representative images of ptf1a:GFP + exocrine pancreas cells from control and DFMO + 2 day withdrawal (5 dpf) Tg(ptf1a:gfp) embryos, illustrating the presence of zymogen granules in the ptf1a:GFP + cells. (f) Quantification of exocrine pancreas length in control (n = 12), DFMO-treated (n = 15), spermidine-treated (n = 14), and DFMO + spermidine-treated (n = 20) Tg(ptf1a:gfp) embryos at 72 hpf. Whereas DFMO treatment resulted in reduced exocrine pancreas length (p < 0.0001), the exocrine pancreas in embryos treated with spermidine alone was longer than DFMO-treated (p < 0.0001) but no different from wildtype (p = 0.1843). DFMO-treatment supplemented with spermidine showed exocrine pancreas length no different from wildtype (p = 0.8176) and significantly longer compared with DFMO-treated embryos (p < 0.0001). dpf, days post fertilization; *p < 0.05, **p < 0.01, ***p < 0.001; ns, not significant. EXPRESSION / LABELING:
PHENOTYPE:
|
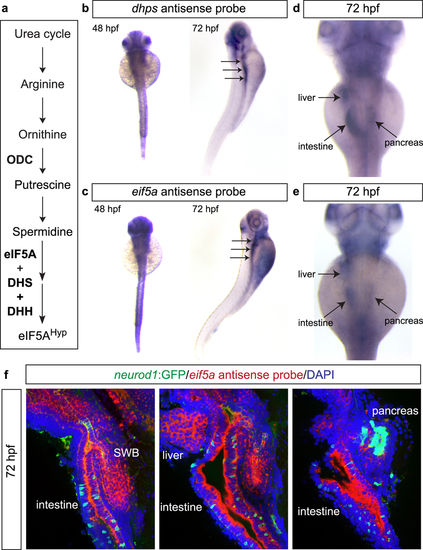
Expression patterns of dhps and eif5a in zebrafish. (a) Pathway illustrating the connection between the polyamine biosynthetic pathway, eIF5A, and DHS. Wholemount in situ hybridization for (b) dhps and (c) eif5a at 48 hpf and 72 hpf. At 72 hpf, higher magnification reveals expression of (d) dhps and (e) eif5a in the liver, intestine and pancreas. (f) Fluorescent in situ hybridization of eif5a in Tg(neurod1:gfp) transgenic fish at 72 hpf confirms expression in endoderm-derived organs, including swim bladder (SWB), intestine, liver, and pancreas. EXPRESSION / LABELING:
|

Knockdown of dhps in the developing zebrafish. (a) Design of the dhps splice-blocking morpholino (MO). (b) Injection of the dhps MO results in a loss of exon 2, as confirmed by RT-PCR from control and MO-injected Tg(ptf1a:gfp) embryos; wildtype dhps, 385 bp; E2 deletion in dhps, 172 bp. (c) dhps MO-injected Tg(ptf1a:gfp) embryos at 72 hpf show a significant pancreatic phenotype after low dose MO injection (1 ng or 2 ng). E, exon; bp, base pair. EXPRESSION / LABELING:
PHENOTYPE:
|
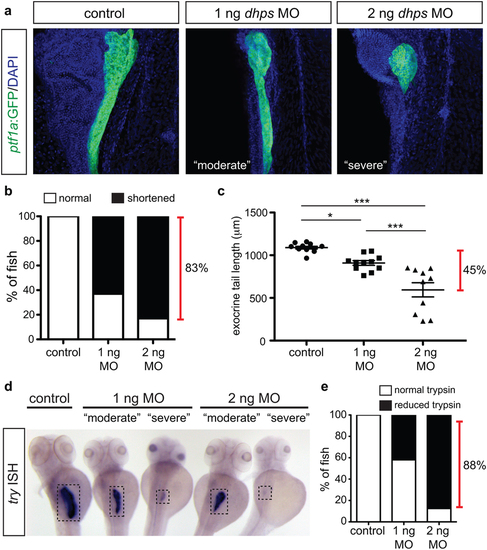
Knockdown of dhps inhibits exocrine cell differentiation. (a) Representative images of the pancreas from control, 1 ng MO-injected, and 2 ng MO-injected Tg(ptf1a:gfp) embryos; images also depict characteristic pancreata with a “moderate” or “severe” defect in exocrine length. (b) The percentage of control (n = 20), 1 ng MO-injected (n = 46), and 2 ng MO-injected (n = 23) embryos with a normal or shortened exocrine pancreas at 72 hpf, as observed by expression of ptf1a:GFP. (c) Quantification of exocrine pancreas length in control (n = 11), 1 ng MO-injected (n = 11), and 2 ng MO-injected (n = 10) embryos (p < 0.0001) at 72 hpf; this shows a 45% difference in exocrine pancreas length. (d) Representative images of in situ hybridization for try (gene encoding trypsin) on control and MO-injected embryos at 72 hpf. (e) The percentage of control (n = 15), 1 ng MO-injected (n = 5), and 2 ng MO-injected (n = 19) embryos with normal or reduced expression of trypsin at 72 hpf. MO, morpholino; *p < 0.05, **p < 0.01, ***p < 0.001. EXPRESSION / LABELING:
PHENOTYPE:
|

Knockdown of dhps inhibits β cell differentiation. (a) Representative images of neurod1:GFP + endocrine cells in the pancreas of control, 1 ng MO-injected, and 2 ng MO-injected Tg(neurod1:gfp) embryos at 72 hpf. Quantification of the number of (b) neurod1:GFP + cells in control (n = 15), 1 ng MO-injected (n = 15), and 2 ng MO-injected (n = 13) embryos (p = 0.0783), and (c) insulin + β cells in control (n = 8), 1 ng MO-injected (n = 8), and 2 ng MO-injected (n = 8) embryos (p = 0.012), at 72 hpf. (d) Representative images of the insulin + β cells from control, 1 ng MO-injected, and 2 ng MO-injected Tg(ptf1a:gfp) embryos at 72 hpf after label-retaining cell (LRC) assay was performed. LRC + cells express H2B-RFP. Quantification of the number of (e) insulin+/RFP + cells (LRC + or dorsal pancreas-derived cells) in control (n = 8), 1 ng MO-injected (n = 8), and 2 ng MO-injected (n = 8) embryos (p = 0.734), and (f) insulin+/RFP- cells (LRC- or ventral pancreas-derived cells) in control (n = 8), 1 ng MO-injected (n = 8), and 2 ng MO-injected (n = 8) embryos (p = 0.0147), at 72 hpf. *p < 0.05, **p < 0.01, ***p < 0.001; ns, not significant. EXPRESSION / LABELING:
PHENOTYPE:
|
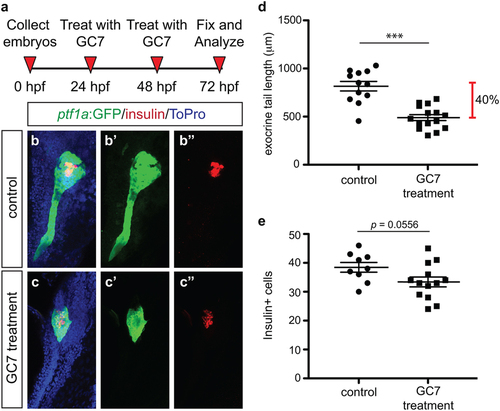
Pharmacological inhibition of DHS with GC7 phenocopies genetic loss of dhps and inhibition of ODC. (a) Inhibitor treatment strategy. Representative maximum intensity projection images of the pancreas from (b) control and (c) GC7-treated Tg(ptf1a:gfp) embryos; for comparison single channel images are also provided for ptf1a:GFP expression in (b′) control and (c′) GC7-treated embryos, and insulin expression in (b′′) control and (c′′) GC7-treated embryos. (d) Quantification of exocrine pancreas length in control (n = 12) and GC7-treated (n = 15) Tg(ptf1a:gfp) embryos at 72 hpf (p < 0.0001); this represents a 40% difference in exocrine pancreas length. (e) Quantification of insulin + β cell number in control (n = 9) and GC7-treated (n = 13) Tg(ptf1a:gfp) embryos at 72 hpf (p = 0.0556). *p < 0.05, **p < 0.01, ***p < 0.001. EXPRESSION / LABELING:
PHENOTYPE:
|
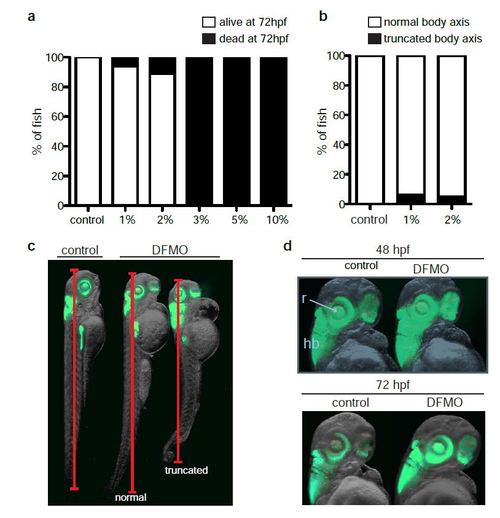
Titration of DFMO in zebrafish. (a) Percentage of viable embryos in control (n = 180), 1% w/v DFMO-treated (n = 33), 2% w/v DFMO-treated (n = 45), 3% w/v DFMO-treated (n = 28), 5% w/v DFMO-treated (n = 24), and 10% w/v DFMO-treated (n = 15) embryos at 72 hpf. (b) Percentage of control (n = 32), 1% w/v DFMO-treated (n = 33), 2% w/v DFMO-treated (n = 40) embryos at 72 hpf with altered body axis due to DFMO treatment. (c) Representative images of control and DFMO-treated Tg(ptf1a:gfp) embryos displaying the phenotype of altered (truncated) body axis. (d) The ptf1a: GFP-expressing retina (r) and hindbrain (hb) were unaltered in DFMO-treated Tg(ptf1a:gfp) embryos compared with controls, at 48 hpf and 72 hpf. |
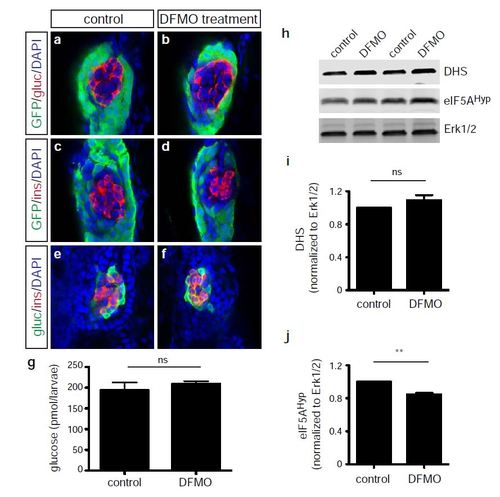
Endocrine cell phenotype following the inhibition of polyamine biosynthesis by DFMO treatment. Representative images at 72 hps of glucagon-expressing cells in (a) control and (b) DFMOtreated Tg(ptf1a:gfp) embryos; insulin-expressing cells in (c) control and (d) DFMO-treated Tg(ptf1a:gfp) embryos; and insulin/glucagon co-expressing cells in (e) control and (f) DFMOtreated Tg(ptf1a:gfp) embryos. (g) Glucose measurement from control or DFMO-treated embryos at 72 hpf (n = 3 groups of 10 embryos/group) (p = 0.4821). (h) Western blot analysis for expression of DHS, eIF5AHyp, and Erk1/2 in control and DFMO-treated embryos at 72 hpf (n = 4 groups of 30 embryos/group); Erk1/2 was used as a loading control, as expression of this protein is not altered with DFMO treatment. Quantification showed no change in (i) DHS expression (p = 0.2370) but a significant decrease in (j) eIF5AHyp expression (p = 0.0039). gluc, glucagon; ins, insulin. * p < 0.05, ** p < 0.01, *** p < 0.001; ns, not significant. |

Expression patterns of eif5a in zebrafish at 48 hpf. At 48 hpf, (a) eif5a has strong expression in the exocrine compartment compared with the (b) neurod1:GFP+ endocrine cell compartment; (c) shows the merged image. (d) Image showing the pancreas (dotted box) and adjacent neural tube. (e) The corresponding maximum intensity projection of eif5a expression in the pancreas at 48 hpf; dotted box denotes pancreas domain. |
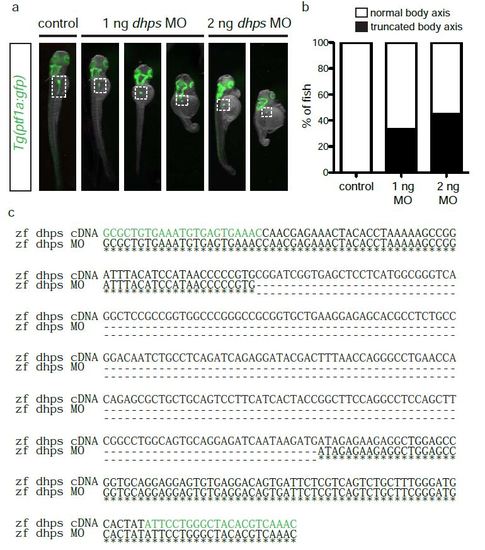
Phenotypic penetrance and expressivity in dhps MO-injected embryos. (a) Control, 1 ng MO-injected, and 2 ng MO-injected Tg(ptf1a:gfp) embryos displaying the phenotype of normal or altered (truncated) body axis. White dotted box demarks pancreas. (b) Percentage of control (n = 20), 1 ng MO-injected (n = 46), and 2 ng MO-injected (n = 23) embryos with altered body axis following implementation of the dhps MO. (c) Sequencing data showing the deletion of exon 2 as a result of dhps MO knockdown. Primers used for PCR amplification are highlighted in green; the deleted region is indicated by dashed lines. |