
IMAGE
Fig. S2
- ID
- ZDB-IMAGE-151029-11
- Publication
- Mastracci et al., 2015 - Polyamine biosynthesis is critical for growth and differentiation of the pancreas
- All Figures
- Figures for Mastracci et al., 2015
Image
|
Figure Caption
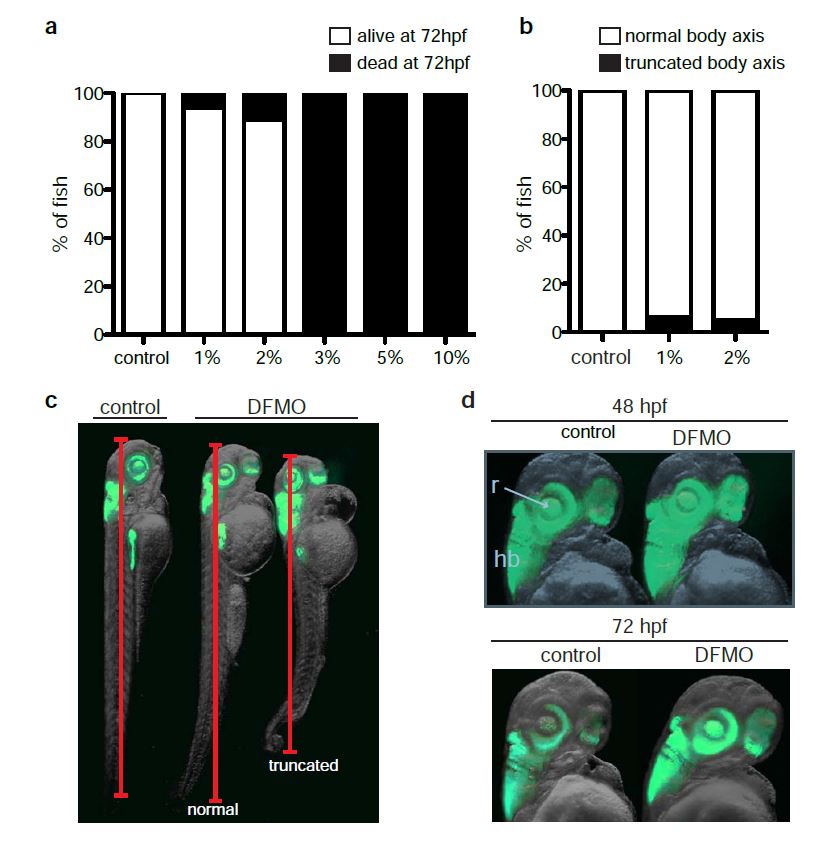
Fig. S2
Titration of DFMO in zebrafish.
(a) Percentage of viable embryos in control (n = 180), 1% w/v DFMO-treated (n = 33), 2% w/v DFMO-treated (n = 45), 3% w/v DFMO-treated (n = 28), 5% w/v DFMO-treated (n = 24), and 10% w/v DFMO-treated (n = 15) embryos at 72 hpf. (b) Percentage of control (n = 32), 1% w/v DFMO-treated (n = 33), 2% w/v DFMO-treated (n = 40) embryos at 72 hpf with altered body axis due to DFMO treatment. (c) Representative images of control and DFMO-treated Tg(ptf1a:gfp) embryos displaying the phenotype of altered (truncated) body axis. (d) The ptf1a: GFP-expressing retina (r) and hindbrain (hb) were unaltered in DFMO-treated Tg(ptf1a:gfp) embryos compared with controls, at 48 hpf and 72 hpf.
Acknowledgments
This image is the copyrighted work of the attributed author or publisher, and
ZFIN has permission only to display this image to its users.
Additional permissions should be obtained from the applicable author or publisher of the image.
Full text @ Sci. Rep.