
Fig. 6
- ID
- ZDB-IMAGE-151029-8
- Genes
- Publication
- Mastracci et al., 2015 - Polyamine biosynthesis is critical for growth and differentiation of the pancreas
- All Figures
- Figures for Mastracci et al., 2015
|
Fig. 6
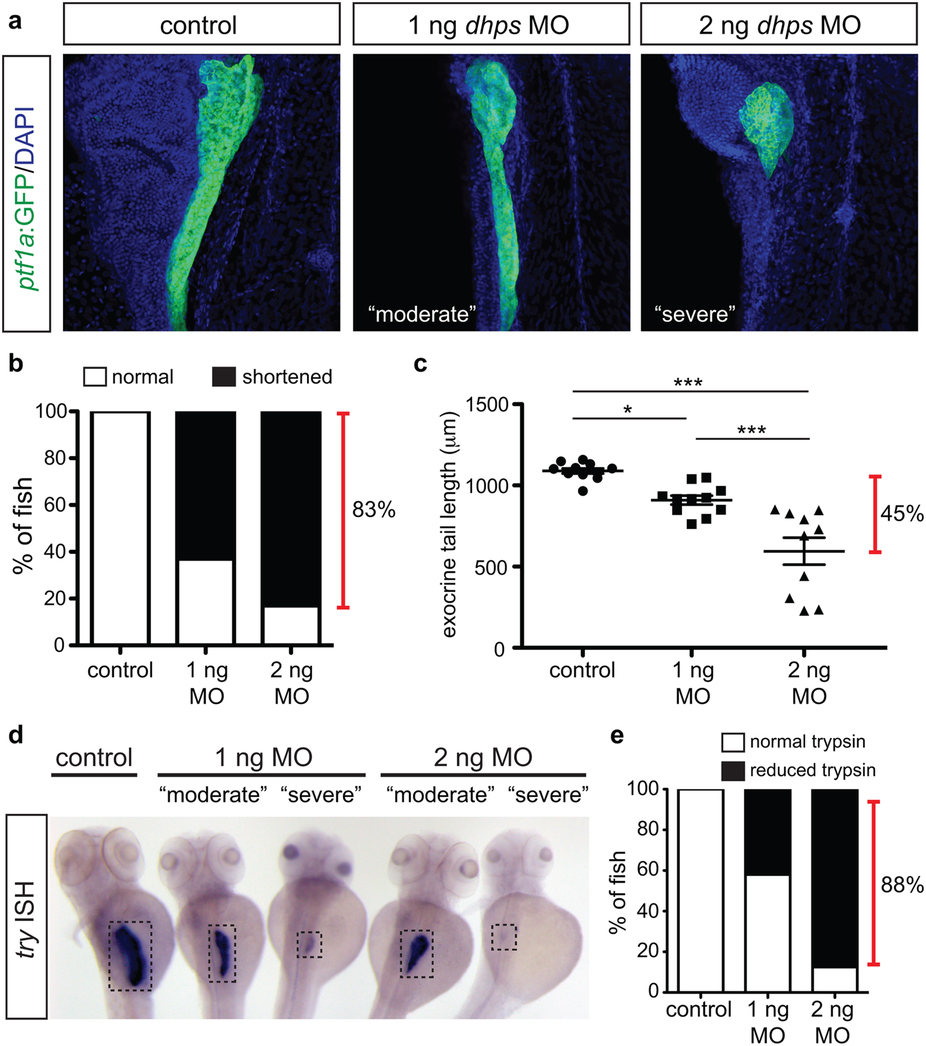
Knockdown of dhps inhibits exocrine cell differentiation.
(a) Representative images of the pancreas from control, 1 ng MO-injected, and 2 ng MO-injected Tg(ptf1a:gfp) embryos; images also depict characteristic pancreata with a “moderate” or “severe” defect in exocrine length. (b) The percentage of control (n = 20), 1 ng MO-injected (n = 46), and 2 ng MO-injected (n = 23) embryos with a normal or shortened exocrine pancreas at 72 hpf, as observed by expression of ptf1a:GFP. (c) Quantification of exocrine pancreas length in control (n = 11), 1 ng MO-injected (n = 11), and 2 ng MO-injected (n = 10) embryos (p < 0.0001) at 72 hpf; this shows a 45% difference in exocrine pancreas length. (d) Representative images of in situ hybridization for try (gene encoding trypsin) on control and MO-injected embryos at 72 hpf. (e) The percentage of control (n = 15), 1 ng MO-injected (n = 5), and 2 ng MO-injected (n = 19) embryos with normal or reduced expression of trypsin at 72 hpf. MO, morpholino; *p < 0.05, **p < 0.01, ***p < 0.001.