
Fig. 2
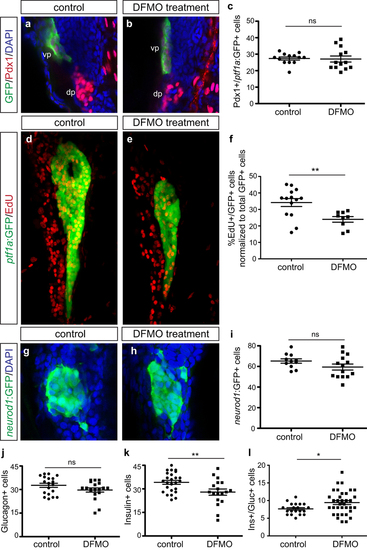
Exocrine and endocrine cell differentiation but not specification is disrupted by DFMO. Representative images of (a) control and (b) DFMO-treated Tg(ptf1a:gfp) embryos stained for Pdx1 and ptf1a:GFP to identify co-expressing ventral pancreas progenitor cells. (c) Quantification of Pdx1+/ ptf1a :GFP + progenitor cells in control (n = 13) and DFMO-treated (n = 13) embryos at 33 hpf (p = 0.8823). Representative images of pancreas from (d) control and (e) DFMO-treated Tg(ptf1a:gfp) embryos at 72 hpf after EdU incorporation. (f) Quantification of the number of EdU-expressing ptf1a:GFP + exocrine cells, normalized to total GFP + cells, in control (n = 14) and DFMO-treated (n = 9) embryos (p = 0.0055). Representative images of neurod1:GFP + endocrine (islet) cells in (g) control and (h) DFMO-treated Tg(neurod1:gfp) embryos at 72 hpf. (i) Quantitation of the neurod1:GFP + endocrine cell population at 72 hpf in control (n = 11) and DFMO-treated (n = 14) embryos (p = 0.1392). Specific endocrine cell populations were also quantified, including (j) Glucagon + α cells (n = 19 for both groups; p = 0.1168), (k) Insulin + β cells (control n = 25; DFMO n = 18; p = 0.0079), and (l) Insulin+/Glucagon + co-expressing cells (control n = 20; DFMO n = 35; p = 0.0282). *p < 0.05, **p < 0.01, ***p < 0.001; ns, not significant; dp, dorsal pancreas; vp, ventral pancreas. |
| Genes: | |
|---|---|
| Fish: | |
| Condition: | |
| Anatomical Terms: | |
| Stage Range: | Prim-15 to Protruding-mouth |
| Fish: | |
|---|---|
| Condition: | |
| Observed In: | |
| Stage Range: | Prim-15 to Protruding-mouth |