
FIGURE
Fig. S6
Fig. S6
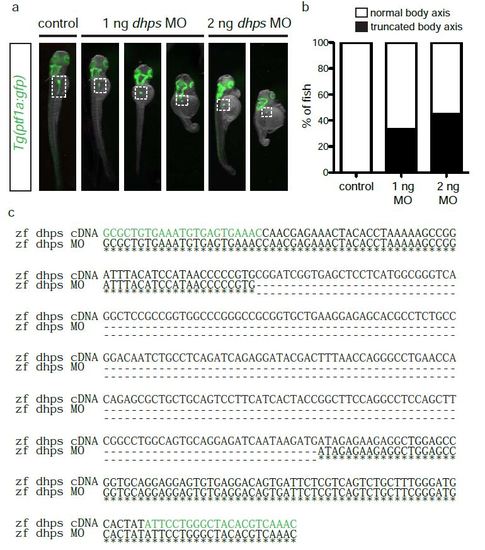
Phenotypic penetrance and expressivity in dhps MO-injected embryos. (a) Control, 1 ng MO-injected, and 2 ng MO-injected Tg(ptf1a:gfp) embryos displaying the phenotype of normal or altered (truncated) body axis. White dotted box demarks pancreas. (b) Percentage of control (n = 20), 1 ng MO-injected (n = 46), and 2 ng MO-injected (n = 23) embryos with altered body axis following implementation of the dhps MO. (c) Sequencing data showing the deletion of exon 2 as a result of dhps MO knockdown. Primers used for PCR amplification are highlighted in green; the deleted region is indicated by dashed lines. |
Expression Data
Expression Detail
Antibody Labeling
Phenotype Data
Phenotype Detail
Acknowledgments
This image is the copyrighted work of the attributed author or publisher, and
ZFIN has permission only to display this image to its users.
Additional permissions should be obtained from the applicable author or publisher of the image.
Full text @ Sci. Rep.