
- Title
-
Znf385C mediates a novel p53-dependent transcriptional switch to control timing of facial bone formation
- Authors
- Hochgreb-Hägele, T., Koo, D.E., Bronner, M.E.
- Source
- Full text @ Dev. Biol.
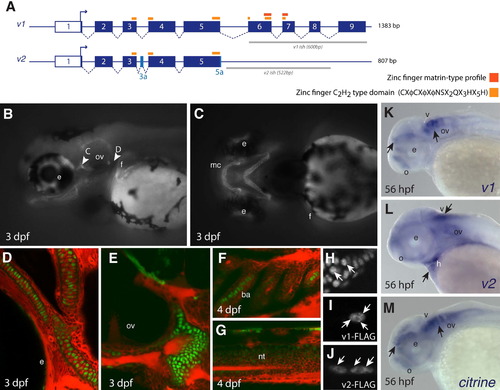
Expression of Citrine in Gt(znf385c-citrine)ct39a depicts nuclear localization of endogenous Znf385C in zebrafish. (A) Schematic representation of znf385c splice variants. Exons in the full-length (v1) or unique to the splice variant (v2) are shown in dark and light blue, respectively. Orange bars: zinc finger domains. Gray bars: target region for anti-sense riboprobe. (B–H) Left side (B, D–G) and ventral views (C). (B and C) Onset of Znf385C expression at 3 dpf in the chondrocytes of the jaws, ears and fins. (D–G) Confocal imaging of live embryos shows nuclear localization (green) of Znf385C in the chondrocytes of the face (D) and ears (E). Low expression level of Znf385C in the branchial arches (F) and dorsal aspect of neural tube (G) at 3 dpf. Counterstaining by BODIPY-TR (red). (H–J) Confocal live imaging of zebrafish chondrocytes at 3 dpf. (H) Expression of endogenous Znf385C in Gt(znf385c-citrine)ct39a. mRNA expression of Znf385C variants V1 (I) and V2 (J). White arrows point punctate pattern condensations for endogenous Znf385C and V1, while V2 is localized in the nuclear periphery. (K–M) Expression of znf385c splice variants by whole mount in situ hybridization at 56 hpf. Lateral views. Black arrows point to areas of znf385c expression. (K) v1 expression in the olfactory region and ventral aspect of the forebrain and hindbrain. (L) v2 is more diffuse, with stronger distribution in the brain ventricle, ears and pharyngeal region. (M) Endogenous znf358c is detected as a fusion with citrine in Gt(znf385c)ct39a line. mc, Meckel’s cartilage; e: eye; ov, otic vesicle; f, fin; ba, branchial arches; nt, neural tube; o, olfactory placode; v, ventricle; h, heart. |
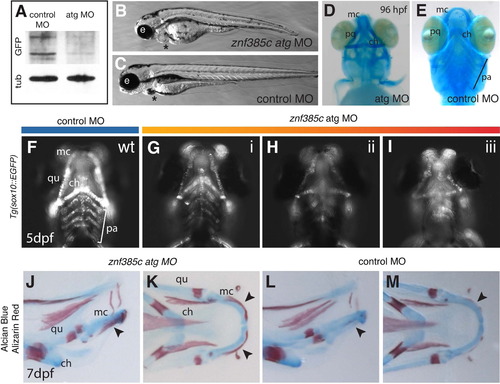
Znf385C loss-of-function results in craniofacial defects and premature ossification of the Meckel’s cartilage. (A) Western blot analysis of Znf385C-Citrine fusion in Gt(znf385c-citrine)ct39a embryos injected with control and translation blocking (atg) morpholinos. Alpha-Tubulin is used as a load control. (B and C) Lateral views. Bright-field of live znf385c morphant (B) and control (C) at 4 dpf. Asterisk indicates cardiac edema. (D–I) Defect in cartilage patterning and maturation in znf385c morphants. Ventral views. (D and E) Alcian blue staining of znf385c morphant and control-MO injected embryos at 96 hpf. (F–I) Four classes of jaw phenotypes in control and znf385c atg MO-injected embryos at 5 dpf using the Tg(sox10:EGFP) background to reveal morphology and cellularity of the jaws in vivo. (J–M) Skeletal preparation with Alcian blue and Alizarin red staining at 7 dpf. Lateral (J and L) and ventral (K and M) views. Black arrowheads indicate premature ossification in the MC of znf385c morphants at 7 dpf (J and K), where similar ossification pattern is observed only at 9 dpf in control and wild-type embryos (L and M). Meckel’s cartilage, mc; ceratohyals, ch; pharyngeal arches, pa; quadrate, qu. |

Znf385C splice variant V2 associates with p53 in the nucleoli and cytoplasm. (A–D) Detection of cell death by Acridine Orange in live znf385c morphant (A and B) and control embryos (C and D) at 52 hpf. Lateral (A and C) and ventral (B and D) views. White arrows point areas of increased cell death in forebrain and hindbrain (A), as well as in heart and pharyngeal region (B). (E and F) Percentage of embryos according to the classes of jaw phenotypes after inactivation of znf385c in zebrafish. Note significant rescue of phenotype by co-injection of full-length mRNA (v1) (E) or partial rescue by co-injection with p53 MO (F). Asterisks indicate statistical significance, NP<0.003 and NNP=0.023. (G) Schematic diagram of BiFC constructs. Sequences encoding Znf385C (v1 or v2) and p53 as a fusion protein to C-terminal (VC) and N-terminal (VN) portions of Venus, respectively. Transfection efficiency was monitored by expression of nuclear H2B-RFP and membrane-RFP, respectively. Green fluorescent signal reveals interaction between Znf385C and p53 fused to hemi-portions of Venus. (H–M) Chicken fibroblast cells transfected with constructs encoding V1–VC (H) or V2–VC (I), and p53-VN (J), alone or combined (K and L). White arrows indicate focal expression of Venus (green) in the nucleoli (L) and in the cytoplasm (M) where V2–VC and p53-VN interact. PHENOTYPE:
|
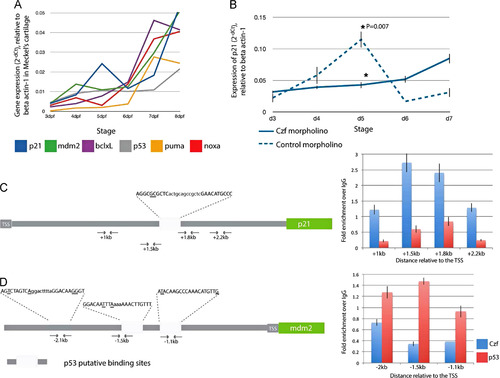
Znf385C as a molecular switch of p21cip1/waf1 expression during maturation of jaw cartilage in zebrafish. (A) Quantitative analysis of p21cip1/waf1 (blue line), mdm2 (green), bcl-xL (purple), p53 (gray), puma (yellow) and noxa (red) expression by qPCR. cDNA template from dissected jaws of zebrafish embryos between 3 and 8 dpf (n=5). Values are expressed in 2dCt±SD, calculated as a ratio to b-actin expression. Black arrow indicates peak of p21 expression at 5 dpf. (B) Quantitative analysis of p21cip1/waf1 expression by qPCR in the jaws of znf385c morphant (blue line) and control (dashed line) embryos. cDNA template from dissected jaws of zebrafish embryos between 3 and 7 dpf (n=5). Values are expressed in 2-dCt±SD, calculated as a ratio to b-actin expression. Asterisk indicate statistical significance, *P=0.007. (C and D) ChIP-qPCR analysis of Znf385C and p53 binding to p21cip1/waf1 (C) and mdm2 (D) regulatory regions. Schematic diagram of gene regulatory regions. Light gray boxes represent p53 putative binding sites and their relative distance to the TSS. p53-binding site half-sites and spacer regions shown in upper- and lower-case, respectively. Mismatches relative to the consensus p53-binding site are underlined. Direct binding of Znf385C (blue) and p53 (red) to the promoter regions of p21cip1/waf1 and mdm2 is expressed as fold enrichment over IgG; graph reflects mean±SD from a representative experiment. |
Reprinted from Developmental Biology, 400(1), Hochgreb-Hägele, T., Koo, D.E., Bronner, M.E., Znf385C mediates a novel p53-dependent transcriptional switch to control timing of facial bone formation, 23-32, Copyright (2015) with permission from Elsevier. Full text @ Dev. Biol.