
Fig. 4
- ID
- ZDB-IMAGE-160811-35
- Genes
- Publication
- Hochgreb-Hägele et al., 2015 - Znf385C mediates a novel p53-dependent transcriptional switch to control timing of facial bone formation
- All Figures
- Figures for Hochgreb-Hägele et al., 2015
|
Fig. 4
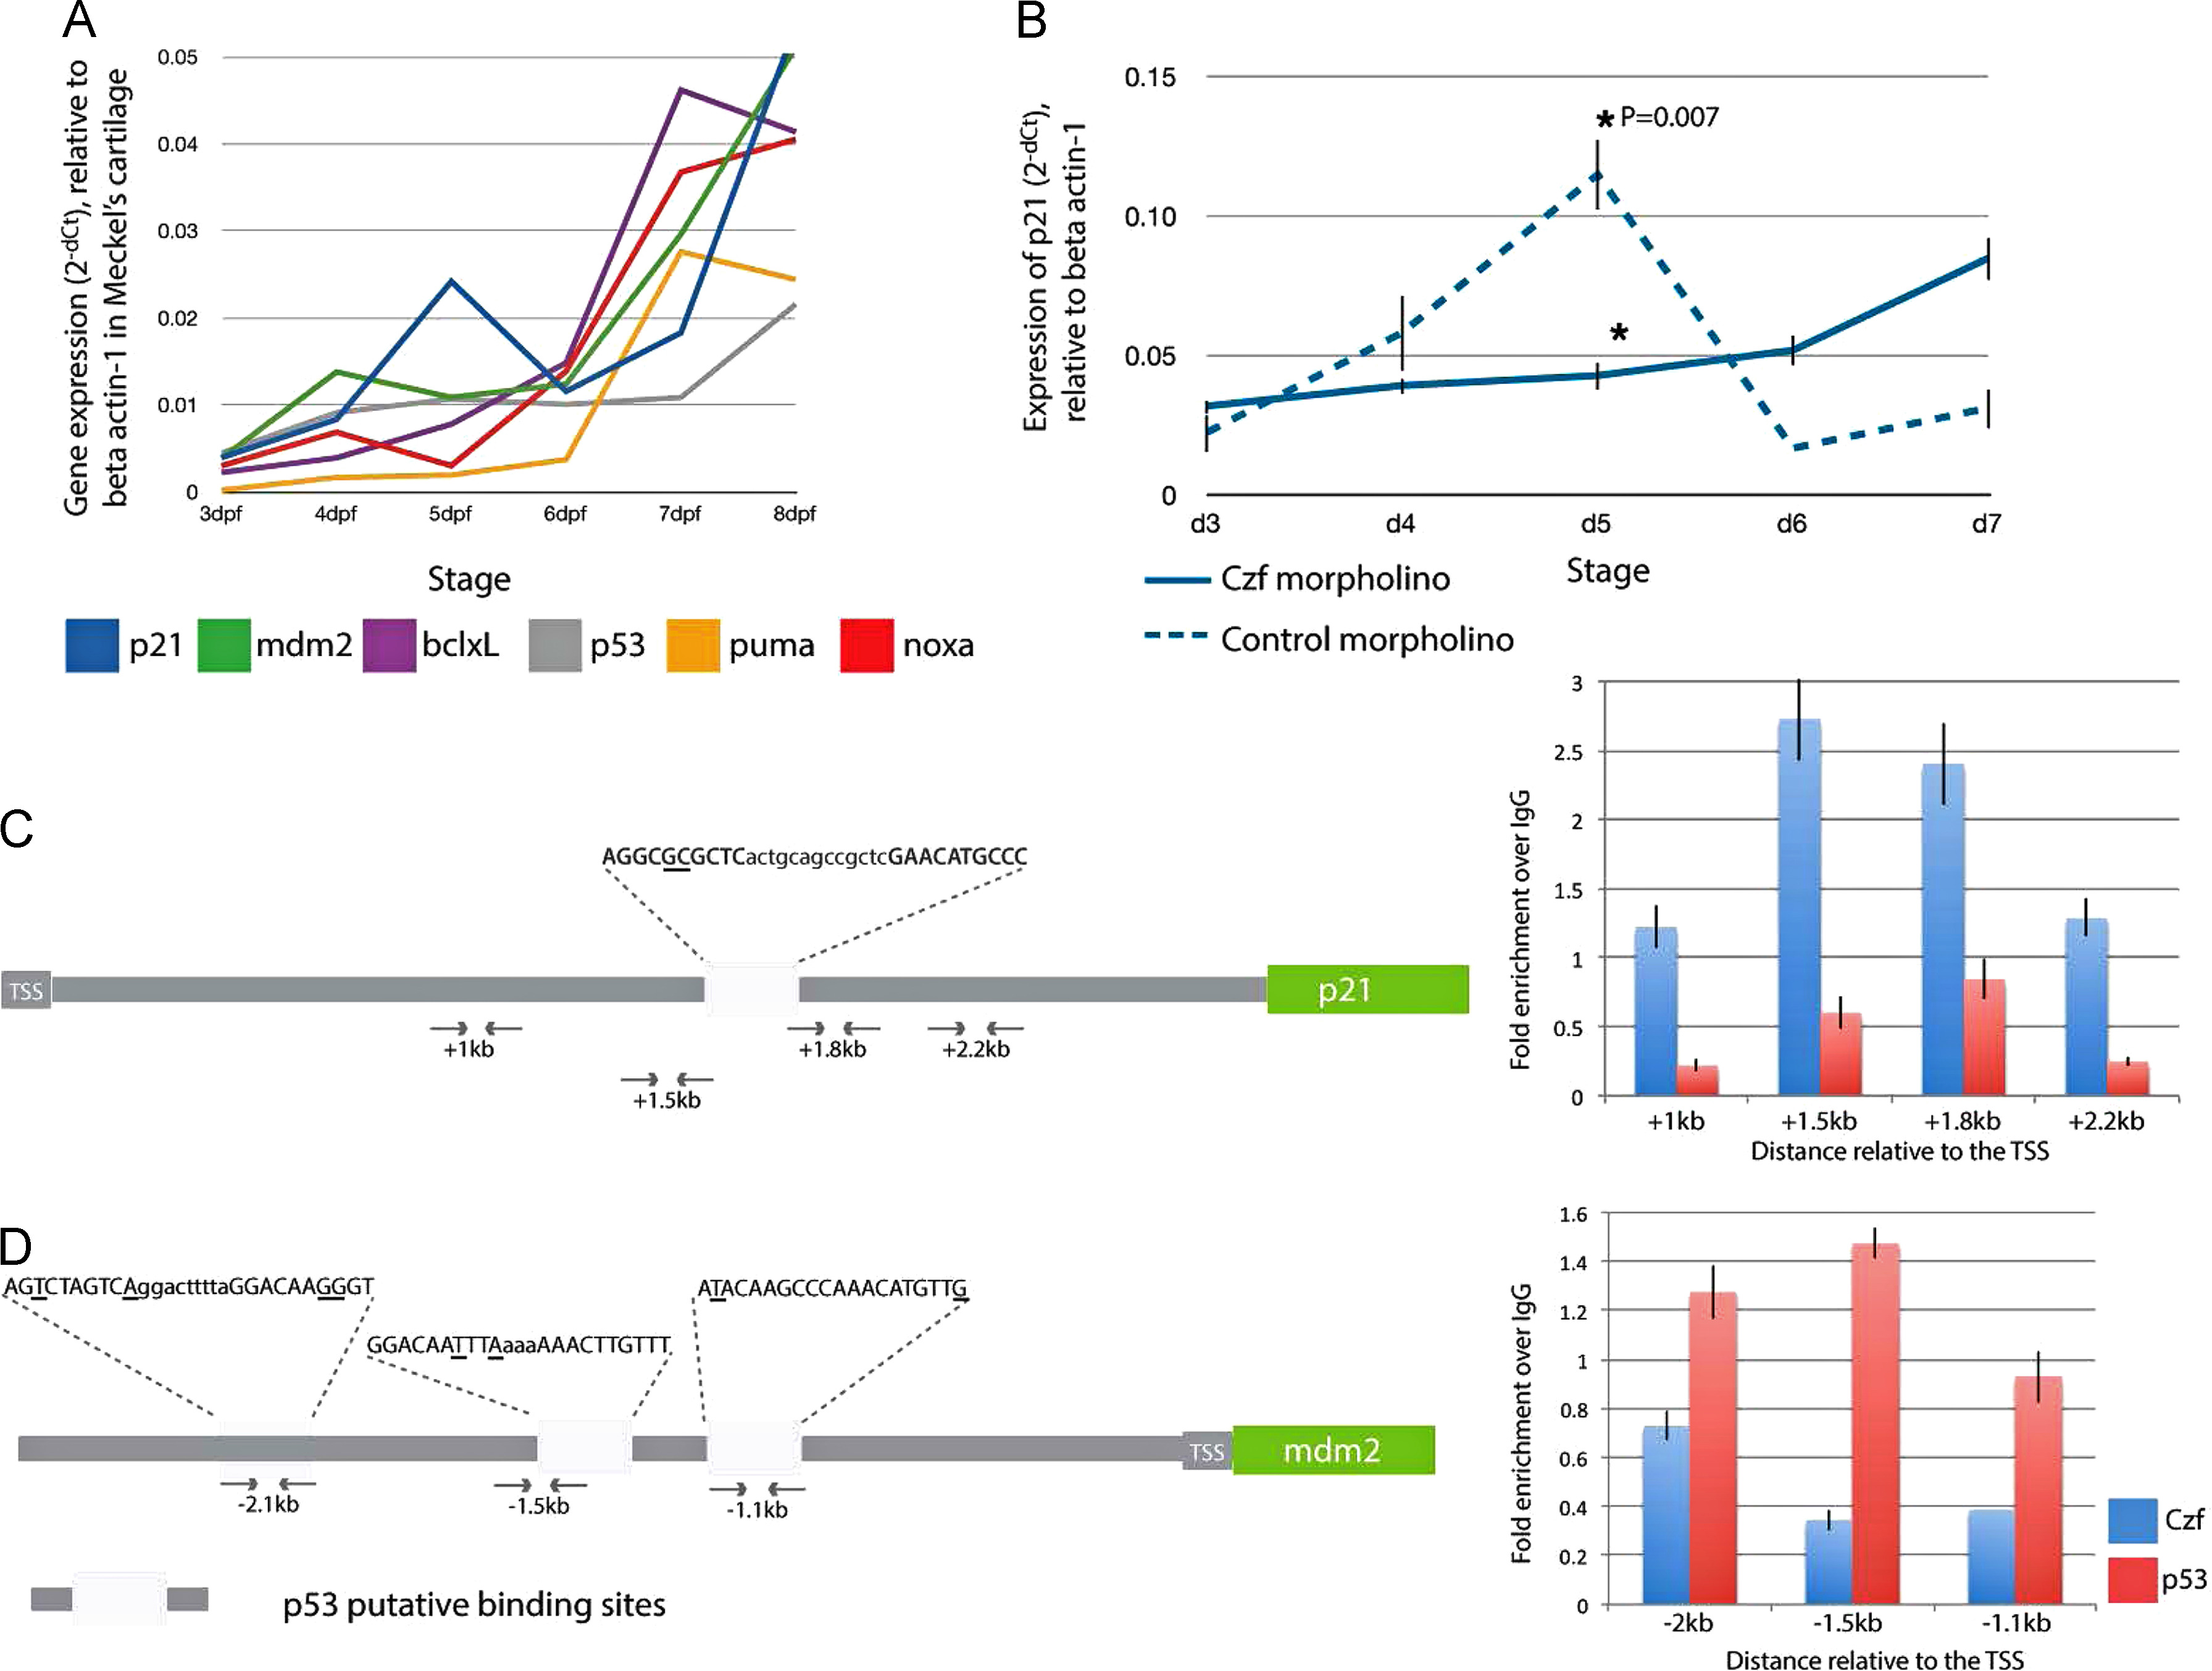
Znf385C as a molecular switch of p21cip1/waf1 expression during maturation of jaw cartilage in zebrafish. (A) Quantitative analysis of p21cip1/waf1 (blue line), mdm2 (green), bcl-xL (purple), p53 (gray), puma (yellow) and noxa (red) expression by qPCR. cDNA template from dissected jaws of zebrafish embryos between 3 and 8 dpf (n=5). Values are expressed in 2dCt±SD, calculated as a ratio to b-actin expression. Black arrow indicates peak of p21 expression at 5 dpf. (B) Quantitative analysis of p21cip1/waf1 expression by qPCR in the jaws of znf385c morphant (blue line) and control (dashed line) embryos. cDNA template from dissected jaws of zebrafish embryos between 3 and 7 dpf (n=5). Values are expressed in 2-dCt±SD, calculated as a ratio to b-actin expression. Asterisk indicate statistical significance, *P=0.007. (C and D) ChIP-qPCR analysis of Znf385C and p53 binding to p21cip1/waf1 (C) and mdm2 (D) regulatory regions. Schematic diagram of gene regulatory regions. Light gray boxes represent p53 putative binding sites and their relative distance to the TSS. p53-binding site half-sites and spacer regions shown in upper- and lower-case, respectively. Mismatches relative to the consensus p53-binding site are underlined. Direct binding of Znf385C (blue) and p53 (red) to the promoter regions of p21cip1/waf1 and mdm2 is expressed as fold enrichment over IgG; graph reflects mean±SD from a representative experiment.
Reprinted from Developmental Biology, 400(1), Hochgreb-Hägele, T., Koo, D.E., Bronner, M.E., Znf385C mediates a novel p53-dependent transcriptional switch to control timing of facial bone formation, 23-32, Copyright (2015) with permission from Elsevier. Full text @ Dev. Biol.