
- Title
-
Post-transcriptional regulation of wnt8a is essential to zebrafish axis development
- Authors
- Wylie, A.D., Fleming, J.A., Whitener, A.E., and Lekven, A.C.
- Source
- Full text @ Dev. Biol.

UTR1 and UTR2 suppress gene expression in cis. (A) Schematic diagram of reporter transgenes utilizing the wnt8a promoter. UTRs (arrows indicating directionality) are ligated into a unique ClaI restriction site. The two transcription start sites present in the promoter are indicated by bent arrows. (B, E, H, and K) Bright field and (C, F, I, and L) fluorescent images of live transgenic 24 hpf embryos, lateral views. (D, G, J, and M) Tails of transgenic embryos after in situ hybridization for EGFP transcripts. Arrows indicate positions of tail tips. (B–D) Reporters with UTR1 are expressed at a significantly lower level than reporters with the UTR1-reverse complement (E–G). (H–J) Reporters with UTR2 are expressed at a significantly lower level than reporters with the UTR2-reverse complement (K–M). EXPRESSION / LABELING:
|
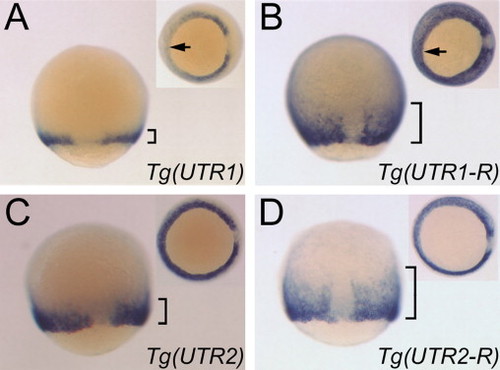
UTR1 and UTR2 regulation occurs during gastrulation. (A and B) In situ hybridizations to EGFP transcripts in 80% epiboly transgenic embryos, dorsal views, anterior up. Insets: vegetal views, dorsal to right. Arrows indicate ventral margin: note absence of staining at ventral margin in (A) but not (B). (C and D) ~70% epiboly. Note that wnt8a is not normally absent from the ventral margin at this stage. All embryos are from transgenic lines expressing reporters under the 2.8 kb wnt8a promoter; genotypes are abbreviated for simplicity. Brackets indicate the extent of staining away from the embryonic margin. Note the significant expansion of transcripts away from the margin for reporters bearing the reverse complement UTR sequences (B and D) in comparison to the forward orientation (A and C). EXPRESSION / LABELING:
|

UTR1 and UTR2 suppress gene expression in transient assays. (A–E) Left column: live embryos at 24 hpf, lateral views. Middle column: corresponding images of EGFP fluorescence. Right column: corresponding images of control mRFP fluorescence. UTR element present in the EGFP reporter transcript is indicated in the middle column. (F) Portion of UTR2, UTR2-mut and potential alignment to miR-430a. The miR-430 seed and seed complement are in red. |

A UTR2 target protector morpholino increases expression of a reporter transgene. (A) Portion of UTR2 and alignment with miR-430a and the target protector morpholino. Region complementary to the seed is bold. (B) Lateral images of live embryos injected with control or UTR2 TP MO. Embryo genotype indicated on left. Injection treatment indicated in center column. Note increased fluorescence in EGFP–UTR2 embryos injected with UTR2 TP MO. Right column: pseudocolored version of center column images. EXPRESSION / LABELING:
|

UTR2 TP MO elevates wnt8a levels. (A–F) In situ hybridizations, 60–80% epiboly. Probe indicated in upper right, relative probe position is shown in Fig. 1. (A, C, and E) Control morpholino injected. (B,D,F) UTR2 TP MO injected. Note increased staining for wnt8a.1 and wnt8a.2. Insets in A and B: Close-up comparison to highlight differences in wnt8a.1. (G) RT-qPCR quantification of expression changes. Y-axis indicates fold change from levels in control injected embryos. Box indicates ±standard deviation, line in box represents mean. Asterisks indicate p<0.01. (H) Lateral views of live 24 hpf embryos. Treatment indicated above each image. (I) Percent of embryos per class after morpholino co-injection. Number in parentheses=n for each treatment. |

Results of rescue experiment. (A–D) Examples of embryos in the four treated groups, lateral views, anterior left. Treatment indicated in lower right corner. (A) Brackets indicate the five different segments measured in each embryo. Region 4 spans from the posterior edge of egr2b to the anterior limit of tbx6l+ staining. (E–H) Plots of measurement data. (E and G) Length of regions 1–3 relative to total embryo length. (F and H) Length of region 5 relative to total embryo length. Diamonds are measurements for individual embryos. Bars show mean values. NNNp<0.001; NNp<0.01; n.s.: not significant. (I and J) Length of regions 1, 2 and 3 relative to the total length of region 1–3. Numbers are percent values for each region. Np<0.05; NNp<0.01; NNNp<0.001. PHENOTYPE:
|

wnt8a.2 over-expression causes a posterior mesoderm defect. Posterior views of tbx6l expression in posterior mesoderm. White arrows indicate equivalent positions in each embryo, corresponding to position of tailbud. Arrowheads point to posterior limit of notochord. Treatment indicated in lower right. (A) Control MO embryo resembles wnt8a.2 MO injected embryo. (B) UTR2 TP MO causes gaps to form (white arrow) in the tbx6l domain near the notochord. (C) Gaps are absent or nearly absent (white arrow) in co-injected embryos. EXPRESSION / LABELING:
|

|

|

|
Reprinted from Developmental Biology, 386(1), Wylie, A.D., Fleming, J.A., Whitener, A.E., and Lekven, A.C., Post-transcriptional regulation of wnt8a is essential to zebrafish axis development, 53-63, Copyright (2014) with permission from Elsevier. Full text @ Dev. Biol.