- Title
-
Phylogeny and expression of canonical transient receptor potential (TRPC) genes in developing zebrafish
- Authors
- von Niederhäusern, V., Kastenhuber, E., Stäuble, A., Gesemann, M., and Neuhauss, S.C.
- Source
- Full text @ Dev. Dyn.
|
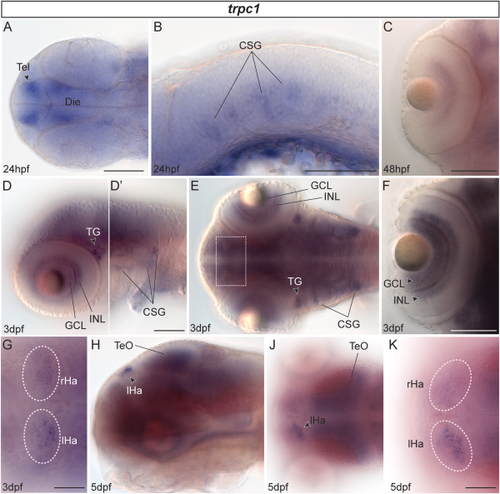
Expression patterns of trpc1 in whole-mount zebrafish. A: Dorsal view of embryonic brain expression 24 hr postfertilization (hpf). B: Lateral close-up of trpc1 expression in CSG 24 hpf. C: Expression of trpc1 in the retinal neuroepithelium in higher magnification 48 hpf; anterior points to the top. D: Lateral view of a larva 3 days postfertilization (dpf) is shown with different focal planes in D and D2. E: Dorsal view of brain expression 3 dpf. F: Staining in the eye of larvae 3 dpf; anterior is up. G: Focus on expression in the habenulae 3 dpf in a dorsal view corresponding to the boxed region in E. Note the differential expression in the left (lHa) and right (rHa) habenula. H: Brain staining in a larva 5 dpf is shown in a lateral view. J.K: Dorsal views on larvae 5 dpf. More cells expressing trpc1 are present in the left compared with the right habenula. Anterior is to the left unless otherwise stated. CSG, cranial sensory ganglia; Die, diencephalon; GCL, ganglion cell layer; INL, inner nuclear layer; Tel, telencephalon; TeO, optic tectum; TG, trigeminal ganglia. Scale bars of 100 µm are indicated in the first picture of a series until changed. The scale bars = 50 µm in G,K. |
|
Expression of zebrafish trpc2 paralogs in the olfactory system. A-E: Images show transcript localization of trpc2a in the olfactory epithelium in frontal (A-C), lateral (D) and dorsal (E) views at the developmental stages indicated. F-H,J,K: Expression of trpc2b in a distal subpopulation of olfactory sensory neurons (OSNs) shown in frontal (F-H), lateral (J), and dorsal (K) whole-mount views. Scale bar = 100 µm in A (applies to all pictures shown). |
|
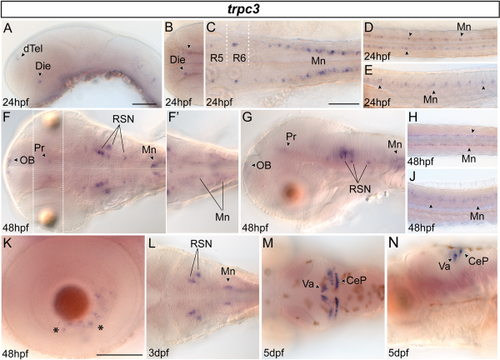
Dynamic trpc3 expression in zebrafish whole-mounts. A: Shows an embryo 24 hr postfertilization (hpf) expressing trpc3 in different forebrain clusters. B: The bilateral neural clusters in the diencephalon expressing trpc3 are shown from dorsal. C: Dorsal view of the hindbrain region. Dashed lines mark approximate boundaries of rhombomeres 5 and 6 (R5, R6). D,E: Dorsal (D) and lateral (E) views of zebrafish tail region 24 hpf with expression in motoneurons. F,G: Expression in the brain at 48 hpf. Dotted field in F shows the same embryo in a different focal plane. F′ depicts a more dorsal plane of the hindbrain region. H,J: trpc3 staining in motoneurons 48 hpf in dorsal (H) and lateral (J) views. K: Lateral view on retinal cells (asterisks) expressing trpc3 transiently around 48 hpf. L: Hindbrain expression of trpc3 in larvae 3 days postfertilization (dpf). M,N: Cerebellar cell clusters expressing trpc3 at 5 dpf shown in dorsal (M) and lateral (N) views. Anterior is always left. CeP, cerebellar plate; Die, diencephalon; dTel, dorsal telencephalon; Mn, motoneurons; OB, olfactory bulb; Pr, pretectum; RSN, reticulospinal neurons; Va, valvula cerebelli. Scale bar = 100 µm in A (for all pictures without scale bar), C,K. |
|
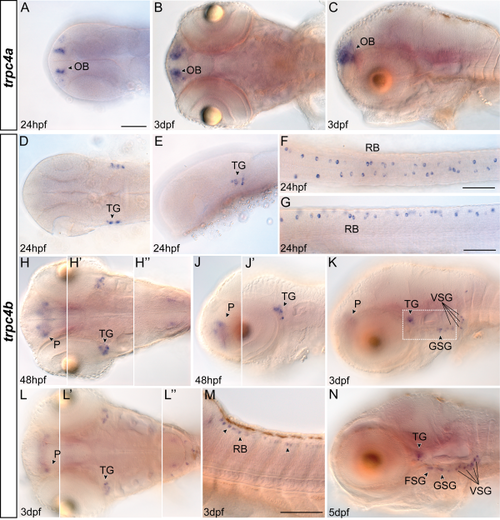
Expression patterns of trpc4 paralogs during development. A-C: Expression of trpc4a was exclusively found in the olfactory bulb. Dorsal (A,B) and lateral (C) views of representative embryonic and larval stages are shown. D-G: Images showing trpc4b staining in embryonic head (D,E) and tail (F,G) region 24 hr postfertilization (hpf) were taken dorsally (D,F) and laterally (E,G). H,J: Whole-mount zebrafish 48 hpf, shown in dorsal (H) and lateral (J) views. Prime figures show the same embryo in different focal planes with H′′ focusing on hindbrain expression. K-M: Lateral (K,M) and dorsal (L) views on trpc4b expression in 3 days postfertilization (dpf) whole-mount larvae. Dotted box in K has a more lateral focal plane compared with core image. L-L′′: different focal planes of the same larva with L′ and L′′ focusing on trigeminal and hindbrain expression, respectively. N: Expression of trpc4b spreads to all cranial sensory ganglia around 5 dpf. Anterior is always left. FSG, facial sensory ganglia; GSG, glossopharyngeal sensory ganglia; OB, olfactory bulb; P, pallium; RB, Rohon-Beard neurons; TG, trigeminal ganglia; VSG, vagal sensory ganglia. Scale bar = 100 µm in A (applies to all images if not otherwise indicated), F,G,M. |
|
A-O: Transcript distribution of trpc5a (A-H) and trpc5b (J-O). A,B: Dorsal (A) and lateral (B) views on the hindbrain region of 24 hr postfertilization (hpf) embryos. C,D: trpc5a expression in brain regions and spinal cord of zebrafish 48 hpf shown dorsally (C) and laterally (D). E: Retinal expression in 3 days postfertilization (dpf) larvae, anterior is up. F: Dorsal view on hindbrain region showing expression in reticulospinal neurons (RSNs) at 3 dpf. G,H: Dorsal (G) and lateral (H) views on 5 dpf larvae with G, G2 and G3 showing different focal planes. J,K: Expression of trpc5b in the diencephalon and hindbrain. J and K show dorsal and lateral views, respectively. L,M: Lateral views on retinal trpc5b expression. N,O: Lateral (N) and dorsal (D) views of whole-mount in situ staining with white asterisks labeling midbrain cells expressing trpc5b 5 dpf. Prime images show different focal planes of the same larvae as in N and O, respectively. Black asterisks in J, K, N′, and O′ mark trpc5b-expressing cell clusters in the hindbrain. Die, diencephalon; GCL, ganglion cell layer; Ha, habenula; Hb, hindbrain; INL, inner nuclear layer; Mn, motoneurons; Tel, telencephalon; TeO, optic tectum. Scale bar = 100 µm in A (for all images without scale bar); 50 µm in E,L,M. |
|
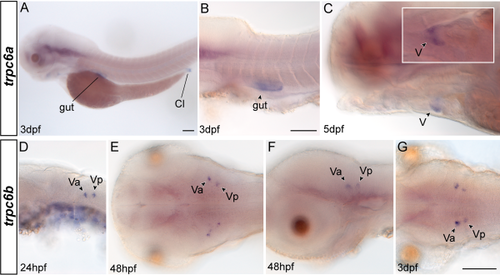
A-G: Expression pattern of trpc6a (A-C) and trpc6b (D-G). trpc6a expression is not detectable before 3 days postfertilization (dpf). A: Lateral overview of WISH in a larva 3 dpf. B: Expression of trpc6a in the gut is shown in a lateral view. C: The heart ventricle (V) expresses the gene, too. Insert is a ventral view on the heart to compare with the lateral view in the main image. D: Expression of trpc6b is present in the hindbrain region 24 hr postfertilization (hpf), lateral view. E,F: Expression of trpc6b in embryos 48 hpf shown in dorsal (E) and lateral (F) views. G: Dorsal head view on the expression in larvae 3 dpf. Anterior is always left. Cl, cloaca; Va, anterior clusters of trigeminal motor neurons; Vp, posterior clusters of trigeminal motor neurons. Scale bar = 100 µm in A (for all pictures of not otherwise indicated), B,G. |
|
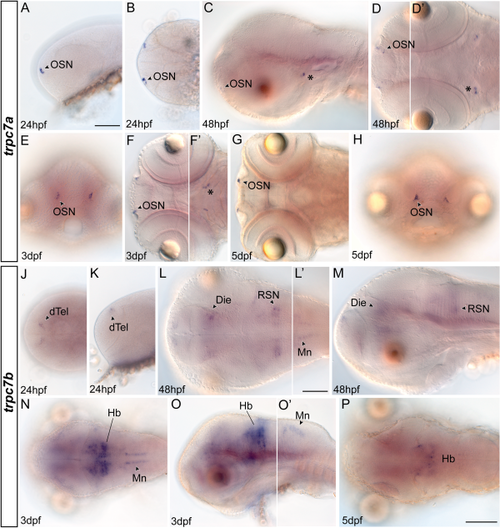
A-P: Whole-mount in situ hybridization of zebrafish trpc7a (A-H) and trpc7b (J-P). A-D: trpc7a-expressing olfactory sensory neurons (OSNs) in embryos shown laterally (A,C) and dorsally (B,D). Asterisks mark expression domains in the midbrain. The focal plane in D′ differs from D. E,F: Frontal (E) and ventral (F) views on 3 days postfertilization (dpf) whole-mount larvae, F′ shows a different focus to F. Asterisk in F′ labels midbrain cell clusters expressing trpc7a transiently. G,H: Dorsal (G) and frontal (H) views on larvae 5 dpf. J,K: Dorsal (J) and lateral (K) view of the telencephalic cell clusters expressing trpc7b in embryos 24 hr postfertilization (hpf). L,M: Expression of trpc7b as detected in zebrafish 48 hpf shown in dorsal (L) and lateral (M) views. Focus in L′ is more dorsal compared with L. N,O: Expression in 3 dpf larvae, shown in dorsal (N) and lateral (O, O′) views. P: Dorsal whole-mount view on trpc7b expression in larvae 5 dpf. Die, diencephalon; dTel, dorsal telencephalon; Hb, hindbrain; Mn, motoneurons; RSN, reticulospinal neurons. Scale bar = 100 µm in A (applies to all images without scale bar), L′, P. |

Unillustrated author statements |

