
- Title
-
Role of connexins in metastatic breast cancer and melanoma brain colonization
- Authors
- Stoletov, K., Strnadel, J., Zardouzian, E., Momiyama, M., Park, F.D., Kelber, J.A., Pizzo, D.P., Hoffman, R., Vandenberg, S.R., and Klemke, R.L.
- Source
- Full text @ J. Cell Sci.
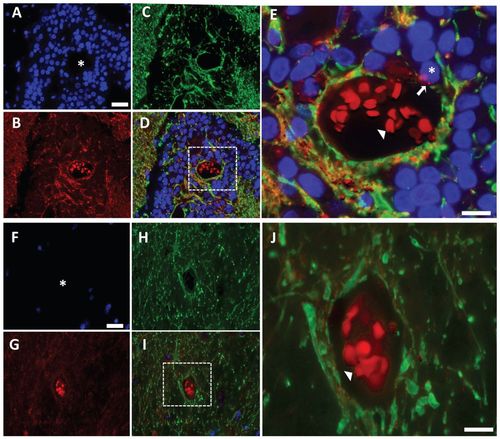
Cx43 expression pattern in brain metastases from breast cancer patients. (A–C) Epifluorescent photomicrographs of a surgically resected brain metastasis from a breast cancer patient triple-stained for (A) nuclei (DAPI, blue), (B) Cx43 (red) and (C) the glial cell marker protein GFAP (green). (D) shows the merged images of A–C. (E) Zoomed region of box in D. Asterisk in A and the box in D show vessel lumen with autofluorescent red blood cells (red; arrowhead in E). Asterisk in E shows tumor on the vessel surface with positive Cx43 staining (arrow). (F–I) Epifluorescent photomicrographs of uninvolved normal brain tissue and associated blood vessel from the same brain metastasis specimen as above. (J) Zoomed region of box in I. Asterisk in F and the box in I show the vessel lumen with autofluorescent red blood cells (red; arrowhead in J). Scale bars: 25μm (A,F), 10μm (E,J). |
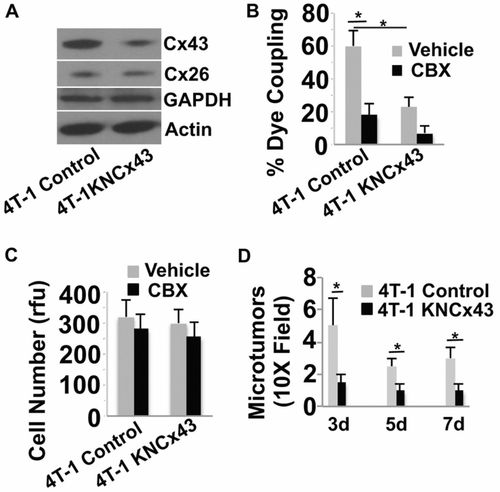
Inhibition of Cx43 expression in breast cancer cells inhibits GJ communication in vitro and inhibits brain colonization in mice. (A). 4T-1 cells were either treated with an empty lentiviral vector (Control) or treated with the lentiviral vector encoding shRNA to Cx43 (4T-1KNcx43) to knock down Cx43 expression. Stable cells lines were then selected and Cx43 expression levels examined by western blotting. Actin, GAPDH and Cx26 served as specificity and loading controls. 4T-1KNcx43 cells show a 78% decrease in Cx43 expression compared with 4T-1 control cells, as measured by densitometry. (B) The indicated tumor cells were prelabeled with calcein orange dye and then added to a monolayer of EA.hy926 endothelial cells in the presence of the GJ inhibitor CBX (10μM) or vehicle PBS. Dye transfer from tumor cells to endothelial cells was observed live by epifluorescence microscopy after 30minutes of co-culture. The number of adherent cells that transferred dye to the adjacent endothelium was determined and represented as percentage of total number of tumor cells counted. (C) The indicated tumor cells were cultured in vitro and examined for cell growth for 3days in the presence of CBX (10μM) or vehicle using the CyQUANT assay. rfu, relative florescence units. (D) Average number of micrometastatic lesions in the mouse brain induced by 4T-1 and 4T-1KNcx43 cells at 3–7 days post injection. Data indicate means + s.e.m. *P<0.05. |
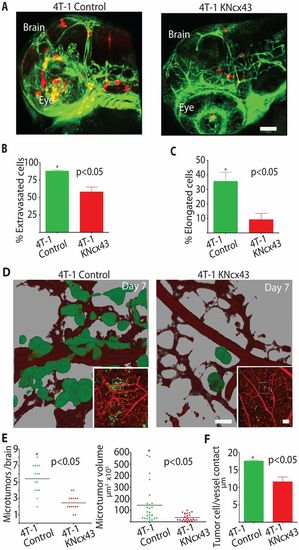
Metastatic breast cancer cell extravasation and brain colonization require Cx43 expression. (A) 4T-1 control or 4T-1KNCx43 cells expressing dsRed were injected into the circulation of Tg(fli1:egfp) transgenic zebrafish and allowed to extravasate in the brain for 24hours. Shown are representative 3D confocal reconstructions of the brain vasculature (green) and tumor cells (red) in the head region. (B) Average percentage of 4T-1 control and 4T-1KNcx43 cells that extravasated out of the vasculature into the brain parenchyma 24hours after injection. (C) Average percentage of extravasated 4T-1 control and 4T-1KNCx43 cells with an elongated invasive morphology in the brain parenchyma. Scale bar: 200μm. (D) 4T-1 control or 4T-1KNCx43 cells expressing GFP were injected into the chicken circulation and allowed to form microtumors in the brain for 7 days. Shown are representative 3D confocal reconstructions of the brain vasculature (red, Rhodamine–lectin stained) and tumor cells (green) (60×). Insets show lower magnification (10×); dashed squares indicate areas enlarged in the main panels. Note that 3D rendering shows that 4T-1 control cells co-opt brain blood vessels whereas 4T-1KNCx43 cells show little vessel association. (E) Number and volume of 4T-1 control and 4T-1KNCx43 microtumor lesions in the chicken brain after 7 days. (F) Average length of tumor-cell blood vessel contacts for 4T-1 control and 4T-1KNCx43 tumor cells after 7 days in the chicken brain. Scale bars: 20μm (main panels), 200μm (insets). |

Expression of the metastatic gene twist in breast cancer cells induces Cx43 expression, tumor cell extravasation and microtumor formation in the brain. (A) Representative images show 3D reconstructions of confocal z-stacks (60×, top views) of HMLE or HMLEtwist cell monolayers co-immunostained with Cx43 (green) and the cell–cell junction marker ZO-1 (red). (B) Western blots of the indicated proteins in HMLE cells transduced with the empty lentiviral vector (HLME), transduced with lenti-twist (HMLEtwist) or expressing twist and shRNAs to Cx43 (HMLEtwistKNCx43). HLMEtwist cells showed a 2.3-fold increase in Cx43 compared with HLME cells and HLMEtwistKNCx43 cells showed a 2.0-fold decrease compared with HLMEtwist cells, as measured by densitometry. (C) HMLE, HMLEtwist or HMLEtwistKNcx43 cells expressing dsRed were injected into the circulation of Tg(fli1:egfp) transgenic zebrafish and allowed to extravasate in the brain for 24hours. Shown are representative 3D confocal reconstructions (20×) of the brain vasculature (green) and tumor cells (red) in the head region. The left-most panel shows 3D reconstruction of the head of a control, non-injected embryo. Insets show higher magnification (60×) of areas delineated by the dashed squares. (D) Brain microtumor formation of HMLE, HMLEtwist and HMLEtwistKNCx43 cells was assessed using the chicken metastasis assay. Representative 3D reconstructions (10×, top views) show confocal z-stacks of chicken embryo brains 3days after intravenous injection of HMLE, HMLEtwist or HMLEtwistKNCx43 cells. (E) Average percentage of HMLE, HMLEtwist or HMLEtwistKNcx43 cells that extravasated in the zebrafish embryo brain 24hours after injection. (F) Average number of microtumors per zebrafish brain induced by HMLE, HMLEtwist and HMLEtwistKNCx43 cells 24hours after injection. (G) Average number of microtumors per chicken brain induced by HMLE, HMLEtwist and HMLEtwistKNCx43 cells 3days after injection. Data indicate means + s.e.m. Scale bars: 20μm (A) or 200μm (C,D). |
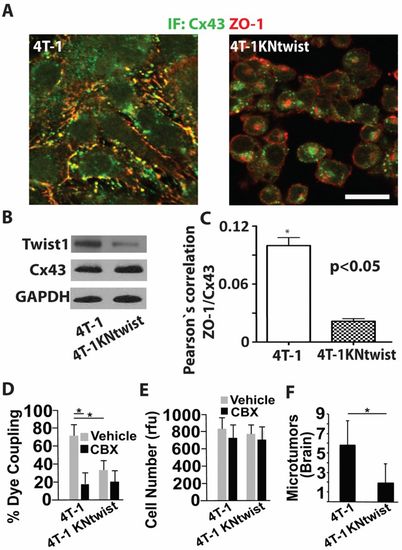
Twist inhibition in metastatic breast cancer cells reduces Cx43-mediated GJ communication and inhibits brain microtumor formation. (A) Representative images show 3D reconstructions of confocal z-stacks (60×, top views) of 4T-1 expressing the empty lentiviral vector or 4T-1 cells expressing lentiviral vectors encoding shRNAs to twist (4T-1KNtwist). Cells were co-immunostained for Cx43 and ZO-1 and imaged as for Fig.4A. Note that in cells with twist depleted, Cx43 is mostly intracellular, whereas ZO-1 is localized to the membrane. Scale bar: 20μm. (B) Western blots of indicated proteins in 4T-1 and 4T-1KNtwist cells. Note that loss of twist expression inhibits membrane localization of Cx43 as shown in A, but not Cx43 total protein levels. 4T-1KNtwist cells show a 71% decrease in Twist1 expression compared to 4T-1 cells, as measured by densitometry. (C) Pearson′s correlation analyses of Cx43 and ZO-1 colocalization in 4T-1 and 4T-1KNtwist cells immunostained as for A. (D) 4T-1 and 4T-1KNtwist cells in the presence of CBX (10μM) or vehicle were examined for GJ-mediated calcein orange dye transfer to the cultured endothelium as described for Fig.2B. (E) 4T-1 and 4T-1KNtwist cell growth in the presence of CBX (10μM) or vehicle was determined as for Fig.2C. (F) The number of 4T-1 and 4T-1KNtwist microtumors was assessed after 7 days in the chicken brain as described for Fig.3D. Data indicate means + s.e.m. *P<0.05. |
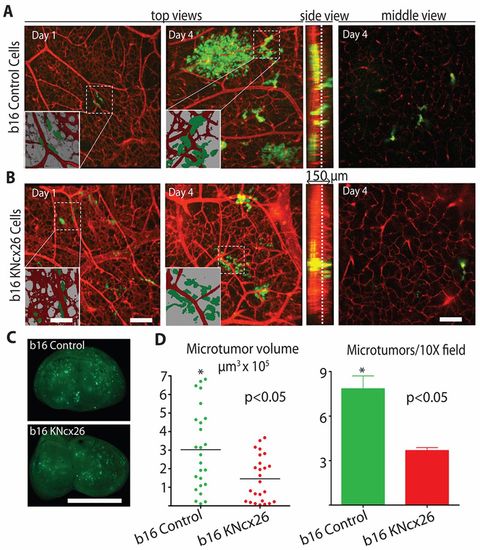
Metastatic melanoma brain colonization requires Cx26. (A,B) b16 metastatic melanoma cells expressing the empty lentiviral vector (A; b16 control) or b16 cells stably expressing lentiviral shRNAs to Cx26 (B; b16KNcx26) along with GFP were injected into the chicken circulation and allowed to form microtumors in the brain for the indicated days. Top views are representative 3D confocal reconstructions of the brain vasculature (red, Rhodamine–lectin stained) and tumor cells (green) (60×). Insets show lower magnification (10×) of boxed areas. Note that 3D rendering shows that b16 control cells co-opt brain blood vessels whereas b16KNcx26 cells show little vessel association. Side view shows confocal z-stacks. Middle view shows representative optical slices from the middle of the z-stacks (slice positions indicated by the dashed lines in the side view). (C) Representative whole chicken brain images 4days after intravenous injection of either b16 or b16KNCx26 cells, showing the level of brain colonization of GFP-labeled tumor cells. (D) Average volume and number of brain microtumors induced by b16 mock or b16KNCx26 cells 4days after injection. Scale bars: 200μm (A,B), 15 μm (A,B, inset), 0.5cm (C). |
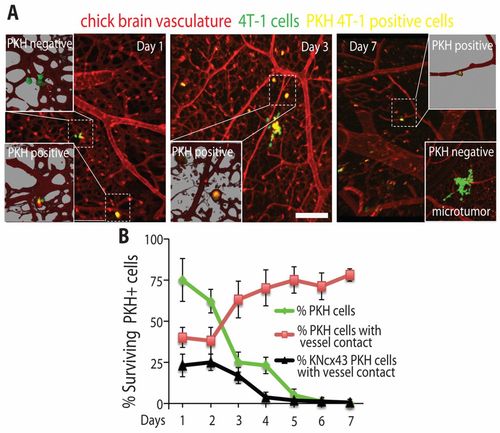
Cx43 expression is necessary for survival of non-proliferating dormant breast cancer cells in the brain. (A) 4T-1 cells expressing GFP (green) and stained with the dye PKH26 (red) were injected into the chicken circulation and allowed to form microtumors in the brain for the indicated days. Confocal images were captured as described for Fig.3D. Non-proliferating, dormant tumor cells retain PKH26 and appear yellow with the green GFP background. The chicken brain vasculature is labeled with Rhodamine–lectin (red). Insets show higher magnification of areas delineated by the dashed squares. Representative example of a PKH26-negative microtumor at day 7 post tumor cell injection is shown in the lower inset. (B) Average percentages of surviving PKH26-positive 4T-1 cells (green) or PKH26-positive 4T-1 (red) and 4T-1KNcx43 (black) cells that directly contact blood vessels in the chicken brain for the indicated days. Data indicate means ± s.e.m. Scale bar: 200 μm. |
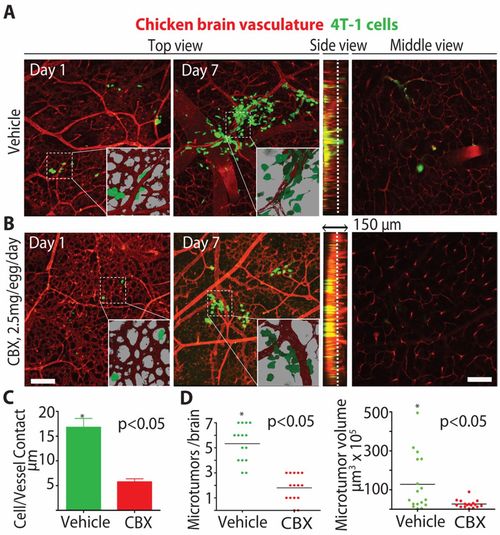
The GJ inhibitor CBX inhibits breast cancer brain colonization. (A,B) Chickens were treated with (A) vehicle or (B) CBX (2.5mg/egg/day) starting 1day before tumor cell injection. Microtumor formation in the brain was assessed at the indicated days using confocal microscopy as described for Fig.6B. Insets show higher magnification (60×) of the areas outlined by the dashed squares. The brain vasculature is labeled with Rhodamine–lectin dye (red). (C) Average length of tumor-cell blood vessel contacts for 4T-1 cells from the brains of vehicle or CBX-treated chicken 6 days after injection. (D) Number and volume of microtumors per chicken brain induced by 4T-1 tumor cells for vehicle or CBX-treated chickens 6 days after injection. Scale bars: 200 μm. |
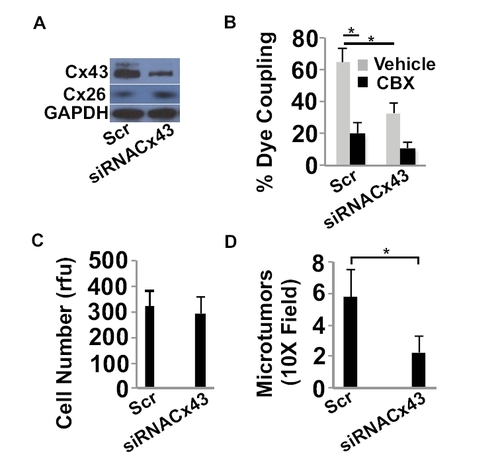
siRNA depletion of Cx43 inhibits GJ communication, and microtumor formation in the brain. (A) 4T-1 cells were treated with a scrambled control RNA (Scr) or siRNA to Cx43 (siRNAcx43) and then western blotted for the indicated proteins. (B) The indicated tumor cells were prelabeled with calcein orange dye and then added to a monolayer of EA.hy926 endothelial cells in the presence of the GJ inhibitor CBX (10 μM) or its vehicle (PBS). Dye transfer from tumor cells to endothelial cells was observed live by epifluorescence microscopy after 30 minutes of co-culture. The number of adherent cells that transferred dye to the adjacent endothelium was determined and represented as percent of total number of tumor cells counted. * = P values < 0.05 (C) The indicated tumor cells were cultured in vitro and examine for cell growth for 3 days in the presence of CBX or its vehicle using the CyQUANT assay. rfu = relative florescence units. (D) 4T-1scr or 4T-1siRNAcx43 cells expressing GFP were injected into the chicken circulation and allowed to form microtumors in the brain. The number of microtumor lesions per 10X field in the brain was determined by confocal microscopy 5 days after injection. * = P values < 0.05. |
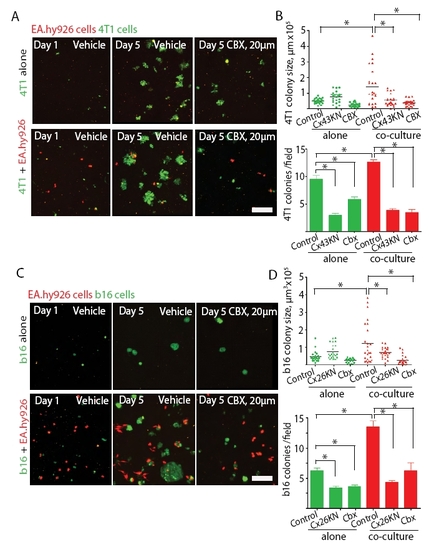
Blocking GJ communication inhibits endothelial cell-induced breast cancer and melanoma colony formation in vitro. (A) 4T-1 tumor cells expressing GFP (green) were cultured for 5 days in three-dimensional Culturex matrix alone or with human EA.hy926 endothelial cells (red, RFP transfected) and treated with vehicle (DMS0) or CBX (20 μM). Upper panel shows 4T-1 cells that were cultured alone and vehicle treated (days 1 and 5) or treated with CBX (day 5). Lower panel shows 4T-1 cells that were cocultured with EAhy.926 and vehicle treated (days 1 and 5) or treated with CBX (day 5). Note, that co-culture with EA.hy926 cells promotes 4T-1 tumor cell colony formation, while CBX treatment inhibits it. (B) Average size and number of 4T-1 or 4T-1KNcx43 tumor cell colonies that were cultured alone or with EA.hy926 cells and treated with CBX or vehicle (control) for 5 days. (C) b16 melanoma cells expressing GFP (green) were cultured for 5 days in 3D Culturex matrix alone or with human EA.hy926 (red, RFP) endothelial cells and treated either with the vehicle (DMSO) or CBX (20 μM). Upper panel shows b16 cells that were cultured alone and vehicle treated (days 1 and 5) or treated with CBX (day 5). Lower panel shows b16 cells that were co-cultured with EA.hy926 and vehicle treated (days 1 and 5) or treated with CBX (day 5). Note, that co-culture with EA.hy926 cells promotes b16 tumor cell colony formation, while CBX treatment inhibits it. (D) Average size and number of b16 or b16KNcx26 cell colonies cultured alone or with EA.hy926 and treated with CBX or vehicle (control) as above. Bars = 200 μm. * = P values < 0.05. |
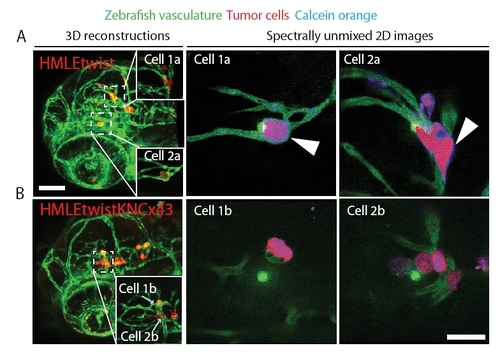
HMLEtwist cells exchange calcein orange dye with brain endothelial cells in connexin 43-dependent manner in vivo. (A) HMLEtwist or (B) HMLEtwistKNcx43 cells were preloaded with calcein orange dye (shown as blue) and injected into the circulation of zebrafish and allowed to form microtumors along the vasculature (green). Dye transfer to the endothelium was monitored in live animals using confocal microscopy. Left panels show 3D reconstructions (20x) of the zebrafish head region with seeded tumor cells. Right panels show higher magnification (60x) of tumor cells delineated with dashed squares. Note the strong presence of the calcein orange dye within the endothelial cells (white arrows) that are located next to HMLEtwist cells, but not in the endothelium adjacent to HMLEtwistKNcx43 cells. Bars = 100 μm in A and 20 μm in B. |
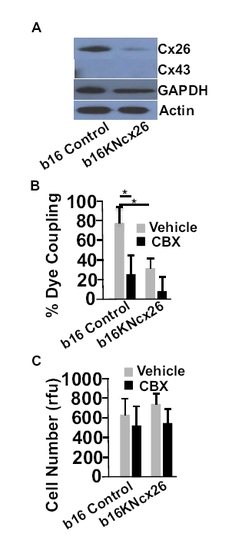
Inhibition of Cx26 expression in b16 melanoma cells inhibits GJ communication with the endothelium. (A) b16 metastatic melanoma cells expressing the empty lentiviral vector (b16 control) or b16 cells stably expressing lentiviral shRNAs to Cx26 (b16KNcx26) were western blotted for the indicated proteins. (B) b16 control and b16KNcx26 cells were tested for their ability to transfer calcein orange dye to the endothelium as described in Fig. S2B. * = P values < 0.05 (C) The indicated tumor cells were cultured in vitro and examine for cell growth after 3 days in the presence of CBX or its vehicle using the CyQUANT assay. rfu = relative florescence units. |