
- Title
-
Intronic Cis-Regulatory Modules Mediate Tissue-Specific and Microbial Control of angptl4/fiaf Transcription
- Authors
- Camp, J.G., Jazwa, A.L., Trent, C.M., and Rawls, J.F.
- Source
- Full text @ PLoS Genet.
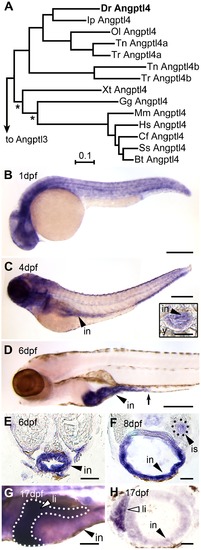
Tissue-specific expression of zebrafish angptl4 mRNA. (A) Distance phylogram of Angptl4 protein from zebrafish (Dr, Danio rerio), catfish (Ip, Ictalurus punctatus), medaka (Ol, Oryzias latipes), tetraodon (Tn, Tetraodoan nigroviridis), fugu (Tr, Takifugu rubipres), xenopus (Xt, Xenopus tropicalis), chicken (Gg, Gallus gallus), mouse (Mm, Mus musculus), human (Hs, Homo sapiens), dog (Cf, Canis familiaris), pig (Ss, Sus scrofa), cow (Bt, Bos taurus). All nodes are significant (>700/1000 bootstrap replicates) except those marked with an asterisk (*). Scale bar indicates phylogenetic distance, in number of amino acid substitutions per site. We found that the genomes of zebrafish, channel catfish (Ictaluris punctatus), and medaka (Oryzias latipes) encode a single ortholog of mammalian Angptl4, whereas two pufferfish species (Takifugu rubripes and Tetraodon nigroviridis) encode two Angptl4 paralogs. See also Figure S1. (B–G) Whole-mount in situ hybridization (WISH) using a riboprobe targeting angptl4 mRNA during various stages in zebrafish development reveals dynamic spatiotemporal gene expression patterns. (B) At 1 day post fertilization (dpf) embryos exhibit ubiquitous expression of angptl4. (C–D) By 4 dpf, marked expression is observed in the intestinal epithelium (in, black arrowhead), but by 6 dpf, robust expression becomes largely localized to the intestine (black arrowhead) and pancreatic islet (not shown). The black arrow marks the boundary between the anterior intestine (segment 1) and mid-intestine (segment 2). Scale bars = 500 μm. (E–F) Transverse sections of 6 dpf and 8 dpf animals confirm expression in the intestinal epithelium (E, in, black arrowhead) and pancreatic islet (F, is, black triangle). Scale bars = 50 μm. (G–H) At 17 dpf, strong expression is observed in the liver (li, white arrowhead, dotted line outlines the liver). G, Scale bar = 250 μm; H, Scale bar = 50 μm. EXPRESSION / LABELING:
|
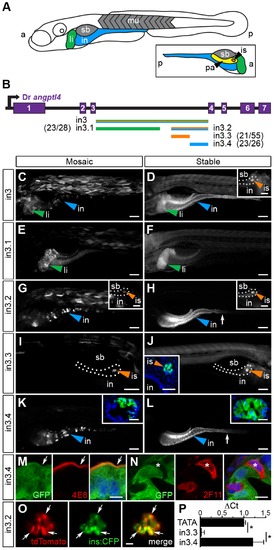
Non-overlapping regulatory modules within angptl4 intron 3 confer liver, islet, and enterocyte-specific reporter expression. (A) Depiction of the 6 dpf zebrafish showing liver (li, green), intestine (in, blue), swim bladder (sb, grey), and muscle (mu, grey), with the fish oriented anterior (a) to the left and posterior (p) to the right. The opposite orientation reveals the exocrine pancreas (pa, yellow) and islet (is, orange). (B) Scaled schematic of the zebrafish angptl4 locus and non-coding DNA assayed for regulatory potential. Modules are color coded according to the tissues in which they confer expression. Ratios of islet or intestine positive fish versus total fish expressing gfp are shown in parentheses next to truncation labels. (C–N) Representative images of GFP reporter expression in mosaic (column 1) and F1 stable (column 2) animals driven by each non-coding DNA region (rows). Scale bars = 100 μm; li = liver, is = islet, in = intestine, sb = swim bladder. Colored arrowheads indicate tissue with specific reporter expression. (C–D) Full-length intron 3 (in3; 2,136 bp) is sufficient to promote expression of the reporter in the liver, islet (D, inset, scale bar = 50 μm), and intestine. (E–F) Truncation in3.1 (1,219 bp) confers expression in the liver. (G–H) Truncation in3.2 (701 bp) confers expression in both the intestine and islet (H, inset). Inset scale bar = 50 μm. (I–J) Truncation in3.3 (387 bp) confers islet expression. A transverse section (inset, J) reveals islet expression (nuclei stained with DAPI). Inset scale bar = 50 μm. (K–L) Truncation in3.4 (316 bp) confers intestinal expression. Insets in panels K and L contain transverse sections showing expression localized to the intestinal epithelium (nuclei stained with DAPI). Inset scale bar = 25 μm. The dotted lines in panels D, G, H, and I outline the pancreas. The white arrows in panels H, K, and L mark the boundary between the anterior intestine (segment 1) and mid-intestine (segment 2). (M–N) Cells expressing GFP driven by the in3.4 regulatory module colocalize with a marker (4E8, red, white arrow) of the brush border of absorptive enterocytes, but fail to co-localize with marker for secretory cells (2F11, red, asterisk). Nuclei stained with DAPI. Scale bars = 5 μm. (O) Intercross of Tg(in3.2-Mmu.Fos:tdTomato) with β-cell specific reporter line (Tg(ins:CFP-NTR)s892) show colocalization of tdTomato and CFP in the islet. Scale bars = 10 μm. (P) Quantitative PCR shows that the in3.4 module and the angptl4 promoter (TATA box), but not the in3.3 module, are hypersensitive to DNase I cleavage in intestinal epithelial cells isolated from adult zebrafish. Asterisks denote P-value<.01 from unpaired T-tests between TATA box or in3.4 and in3.3 regions. Error bars represent standard deviation from four biological replicates using cells pooled from 3 wild-type adult zebrafish per replicate. EXPRESSION / LABELING:
|
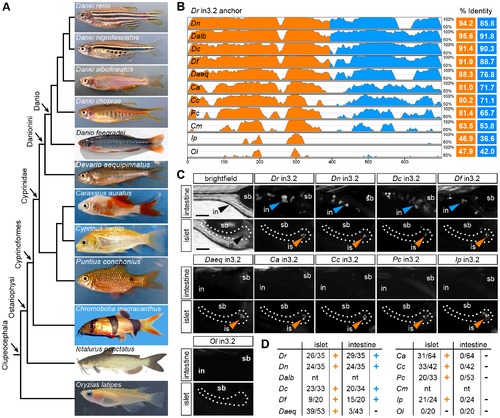
Functional evolution of the islet and intestinal regulatory modules in 12 fish species. (A) Unscaled phylogram based on information from [58], [59] showing images and relative relationships of 12 fish for which intronic sequences were analyzed. Danio rerio (Dr, zebrafish), Danio nigrofasciatus (Dn), Danio albolineatus (Dalb), Danio choprae (Dc), Danio feegradei (Df), Devario aequipinnatus (Daeq, giant danio), Carassius auratus (Ca, goldfish), Cyprinus carpio (Cc, carp), Puntius conchonius (Pc, rosy barb), Chromobotia macracanthus (Cm, clown loach), Ictalurus punctatus (Ip, channel catfish), Oryzias latipes (Ol, medaka). (B) VISTA plot displaying the global pairwise alignment of orthologous in3.2 regions from each species anchored to zebrafish (Dr) in3.2. Orange peaks correspond to regions in the alignment that correspond to Dr in3.3 (islet module). Blue peaks correspond to regions in the alignment that correspond to Dr in3.4 (intestine module). Percent identity is calculated from pairwise alignments of each module with zebrafish (VISTA parameters: 25 bp sliding window, LAGAN alignment). (C) Representative islet and intestinal images from injections of each orthologous in3.2 module. Orange or blue arrowheads mark positive islet or intestine expression, respectively. The absence of arrowheads denotes negative expression in each tissue. (D) Summary of mosaic expression for each species. Ratios of islet or intestine positive fish versus total fish expressing gfp are shown. Orange or blue (+) denotes that the construct was sufficient to confer expression in the islet or intestine, respectively. Black (-) denotes insufficiency. Note that Dalb and Cm sequences were not tested (nt) in this heterologous functional assay. See also Figures S5 and S6. |
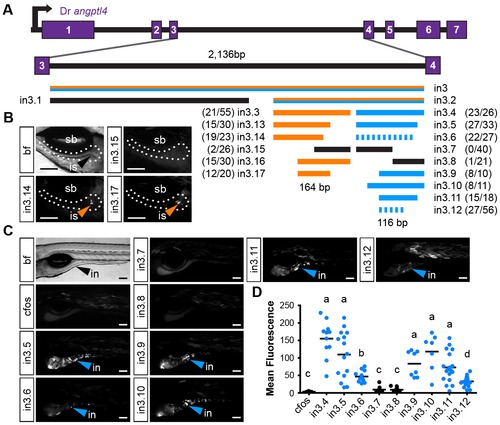
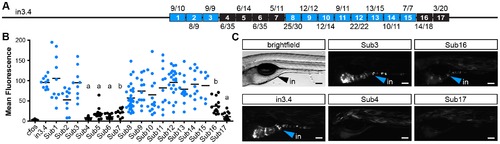
Truncation mapping of the islet and intestinal regulatory module. (A) Scaled schematic of the zebrafish angptl4 locus showing annotations of truncations assayed for regulatory potential. Orange lines indicate sufficiency to confer islet expression, blue lines indicate sufficiency to confer intestinal expression, and black lines indicate insufficiency in intestine and islet. Dashed blue lines indicate reduced intestinal expression compared to in3.4. Ratios of islet or intestine positive fish versus total fish expressing gfp are shown in parentheses next to truncation labels. (B) Representative images of islet views from mosaic injected fish of each truncation construct. Orange arrows mark islet expression (is). Scale bars = 100 µm. (C) Representative images of intestinal views from mosaic fish injected with each truncation construct. Blue arrows mark intestinal expression (in). Scale bars = 100 μm. (D) Relative mean intestinal fluorescence within the intestine was quantified in mosaic animals (see Materials and Methods) and plotted per injected fish. Circles represent mean fluorescence averaged for three mosaic patches within one fish, and are colored blue or black to designate truncations that are sufficient or insufficient to confer intestinal expression, respectively. Statistical significance was tested using Kruskal-Wallis one-way analysis of variance (labels: a = P<.001, b = P<.05 vs. Fos; c = P<.001, d = P<.01 vs. in3.4). Scale bars = 100 μm. |
Site-directed mutagenesis defines DNA motifs required for intestinal expression. (A) Scaled schematic showing 10 bp substitution blocks tiled across the zebrafish angptl4 in3.11 region within the context of the entire in3.4 intestinal module. Black or blue blocks represent mutations that do or do not significantly alter intestinal expression compared to wild type in3.4, respectively (see below). Ratios of intestine positive fish versus total fish expressing GFP are shown in parentheses above or below substitution block labels. (B) Relative mean intestinal fluorescence was quantified in mosaic animals (see Materials and Methods) and plotted per injected fish. Circles represent mean fluorescence averaged for three mosaic patches within a single fish and are colored blue or black to designate mutations that do or do not confer intestinal expression, respectively. Statistical significance was tested using Kruskal-Wallis one-way analysis of variance (labels: a = P<.01 vs. in3.4, P>.05 vs. Fos; b = P>.05 vs. Fos; unlabeled = P>.05 vs. in3.4, P<.01 vs. Fos). (C) Images from animals with mosaic expression of five representative mutant constructs are shown. Blue arrows indicate intestinal expression (in). Scale bars = 100 μm. |
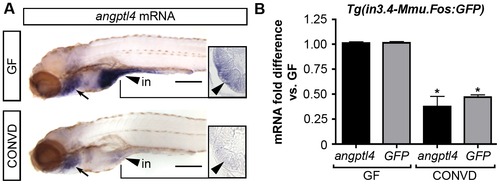
The intestinal module in3.4 recapitulates microbial suppression of angptl4. (A) Semi-quantitative whole mount in situ hybridization of angptl4 mRNA in 6 dpf germ-free (GF) and conventionalized (CONVD) animals. Arrowheads mark intestinal expression. Note that the background staining in the gills (arrows) is similar in GF and CONVD fish. Transverse sections show that microbial suppression of angptl4 mRNA is specific to the intestinal epithelium. (B) Quantitative RT-PCR of angptl4 and GFP mRNA levels in 6 dpf GF and CONVD Tg(in3.4-Mmu.Fos:GFP) animals. GF and CONVD animals were derived from the same Tg(in3.4-Mmu.Fos:GFP) stable line. GFP and angptl4 mRNA were normalized to 18S rRNA levels and are shown as fold difference compared to GF controls averaged across 3 experimental replicates ± SEM (2 biological replicate groups of 10 larvae per condition per experiment). Similar results were attained when normalized to ribosomal protein L32 (rpl32) rRNA levels. Asterisks denote P-value<.01 from unpaired T-test between GF and CONVD conditions for each gene. See also Figure S8. EXPRESSION / LABELING:
|
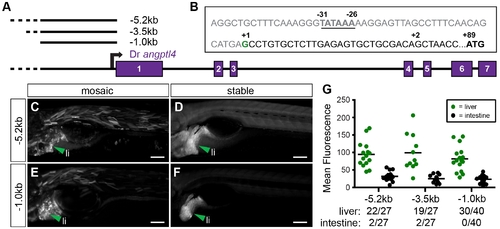
Non-coding DNA upstream of the zebrafish angptl4 transcription start site drives expression in the liver but not in the intestine or islet. (A) The zebrafish angptl4 locus and positions of promoter regions assayed in 0–7 dpf transgenic zebrafish are annotated to scale. (B) 52 RACE and EST data (not shown) establish a single transcription start site directly upstream of exon 1. The positions of the TATA box, transcription start site, and translation start site are annotated. (C, E) Non-coding DNA -5.2 kb and -1 kb upstream of the translation start site drives expression in the liver in 6 dpf mosaic animals. Note that the -5.2 kb fragment includes a region -4.9 kb upstream from the TSS that shares extensive homology with medaka (see Figure 2A). Scale bars = 50 μm. (D, F) Liver expression pattern is confirmed in the F1 generation of injected animals harboring stable insertions of the -5.2 kb (Tg(-5.2angptl4:GFP)) and -1 kb transgenes (Tg(-1angptl4:GFP)). Scale bars = 50 μm. (G) Fluorescence intensity in mosaic animals is quantified (see Materials and Methods) in the liver and intestine. Circles represent mean fluorescence averaged in three mosaic patches within the liver (green) or intestine (black) of 1 fish. Note that there is minimal to no reporter expression in either the intestine or the islet (not shown). Ratios of liver or intestine positive fish versus total fish expressing GFP are shown below the corresponding construct name. |
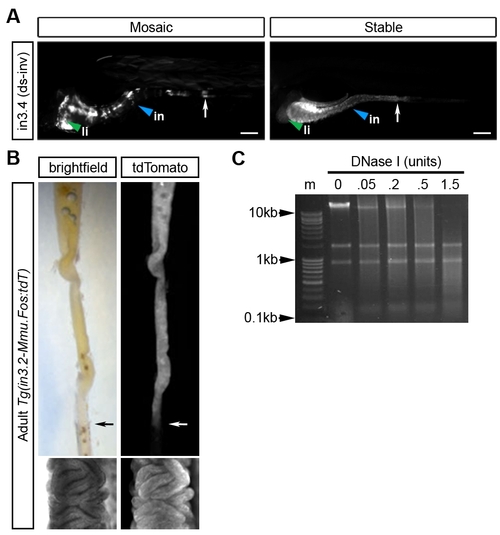
The zebrafish angptl4 in3.4 intestinal module exhibits hallmarks of a classical enhancer. (A) Dr in3.4 was cloned in an inverted orientation (in3.4(ds-iv)) downstream of GFP driven by -1 kb of the angptl4 promoter (Tg(-1angptl4:GFP:in3.4inv)). Mosaic and stable intestinal expression patterns are indistinguishable from those when in3.4 is upstream of the Fos minimal promoter (see Figure 3). The white arrow marks the boundary between the anterior intestine (segment 1) and mid-intestine (segment 2). The marked liver expression is likely conferred by the -1 kb angptl4 promoter (see Figure S3F). (B) The in3.2 module drives expression of a reporter (tdTomato) in the intestinal epithelium of adult zebrafish. (C) Nuclei were isolated from adult zebrafish epithelial cells and subjected to increasing concentrations of DNase I. Digested DNA from 0.5 units DNase I was used for quantitative PCR shown in Figure 3P. |