
Fig. 1
- ID
- ZDB-FIG-120412-32
- Publication
- Camp et al., 2012 - Intronic Cis-Regulatory Modules Mediate Tissue-Specific and Microbial Control of angptl4/fiaf Transcription
- Other Figures
- All Figure Page
- Back to All Figure Page
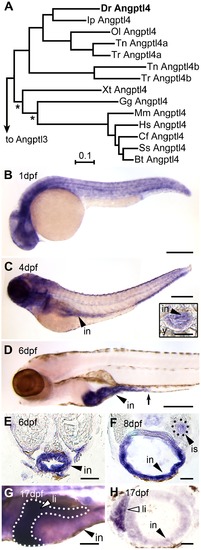
Tissue-specific expression of zebrafish angptl4 mRNA. (A) Distance phylogram of Angptl4 protein from zebrafish (Dr, Danio rerio), catfish (Ip, Ictalurus punctatus), medaka (Ol, Oryzias latipes), tetraodon (Tn, Tetraodoan nigroviridis), fugu (Tr, Takifugu rubipres), xenopus (Xt, Xenopus tropicalis), chicken (Gg, Gallus gallus), mouse (Mm, Mus musculus), human (Hs, Homo sapiens), dog (Cf, Canis familiaris), pig (Ss, Sus scrofa), cow (Bt, Bos taurus). All nodes are significant (>700/1000 bootstrap replicates) except those marked with an asterisk (*). Scale bar indicates phylogenetic distance, in number of amino acid substitutions per site. We found that the genomes of zebrafish, channel catfish (Ictaluris punctatus), and medaka (Oryzias latipes) encode a single ortholog of mammalian Angptl4, whereas two pufferfish species (Takifugu rubripes and Tetraodon nigroviridis) encode two Angptl4 paralogs. See also Figure S1. (B–G) Whole-mount in situ hybridization (WISH) using a riboprobe targeting angptl4 mRNA during various stages in zebrafish development reveals dynamic spatiotemporal gene expression patterns. (B) At 1 day post fertilization (dpf) embryos exhibit ubiquitous expression of angptl4. (C–D) By 4 dpf, marked expression is observed in the intestinal epithelium (in, black arrowhead), but by 6 dpf, robust expression becomes largely localized to the intestine (black arrowhead) and pancreatic islet (not shown). The black arrow marks the boundary between the anterior intestine (segment 1) and mid-intestine (segment 2). Scale bars = 500 μm. (E–F) Transverse sections of 6 dpf and 8 dpf animals confirm expression in the intestinal epithelium (E, in, black arrowhead) and pancreatic islet (F, is, black triangle). Scale bars = 50 μm. (G–H) At 17 dpf, strong expression is observed in the liver (li, white arrowhead, dotted line outlines the liver). G, Scale bar = 250 μm; H, Scale bar = 50 μm. |
| Gene: | |
|---|---|
| Fish: | |
| Anatomical Terms: | |
| Stage Range: | Prim-5 to Days 14-20 |